Welcome to our website!
Cart 0

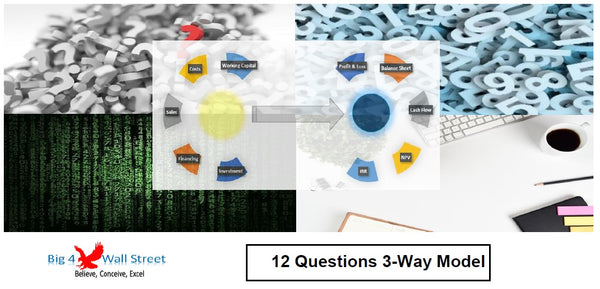
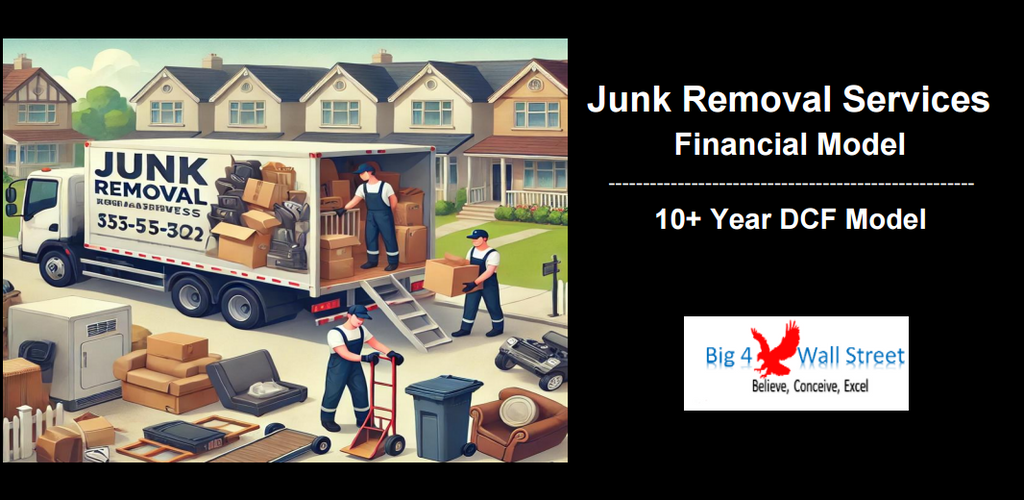
Junk Removal Services - Financial Model (10+ Yrs. DCF and Valuation)

€70.00

The Junk Removal Services Business Financial Model with a 10+ Years DCF (Discounted Cash Flow) and Valuation provides a comprehensive analysis of the financial aspects of a junk removal service. It includes detailed projections for service demand, operational costs, and revenue streams. This model helps in understanding the long-term financial performance, revenue potential, and profitability of the junk removal business, enabling informed decision-making and strategic planning. Additionally, it produces financial statements, valuation, and break-even analysis.

Key Components:

1.    Service Demand: Projections for the number of junk removal jobs based on demand and capacity.

2.    Operational Costs: Breakdown of costs including labor, transportation, disposal fees, and equipment maintenance.

3.    Revenue Streams: Income from junk removal fees, recycling sales, and potential partnerships for reselling some items.

4.    Capital Expenditures (CapEx): Investments in trucks, equipment, and technology.

5.    10+ Years DCF and Valuation: Long-term financial projections, including DCF analysis to assess the business's value and Investment KPIs (IRR, NPV, Payback).

6.    Financial Statements: Projections of the income statement, balance sheet, and cash flow statement.

7.    Break-Even Analysis: Calculation of the break-even point based on fixed and variable costs.

Key Benefits:

1.    Informed Decision Making: Provides detailed insights into cost structures, revenue streams, and profitability.

2.    Strategic Planning: Helps in planning service expansion, equipment upgrades, and market penetration strategies.

3.    Profitability Analysis: Assesses the financial viability of different pricing strategies and service offerings.

4.    Investment Appeal: A robust financial model to present to potential investors and secure funding.

------------------------------------------------------------------------------------------------

MODEL GUIDELINES

So, a quick overview of the model, in the contents tab you can see the structure of the model and by clicking on any of the headlines to be redirected to the relevant worksheet.


On the manual tab you can feed the general information for the model such as: project name & title, responsible, timeline of the model and date and currency conventions.


Additionally, there is a description of the color coding of the model in the same tab. Inputs are always depicted with a yellow fill and blue letters, call up (that is direct links from other cells) are filled in light blue with blue letters while calculations are depicted with white fill and black characters.


There is also color coding for the various tabs of the model. Yellow tabs are mostly assumptions tabs, grey tabs are calculations tabs, blue tabs are outputs tabs (that is effectively results or graphs) and finally light blue tabs are admin tabs (for example: the cover page, contents, and checks).


Moving on to the Inputs: detailed inputs for revenues such as junk removal fees for various pickup modalities (one off, full, subscription based), recycling fees, and reselling fees and costs splits between direct costs and indirect costs (such as admin staff, outsourced staff, insurance, advertising & promotions as well as other costs), working capital (receivables, payables, and inventory), fixed assets and capex (split into start up investment and new maintenance capex), debt & equity financing as well as valuation assumptions (such as discount rates used in the weighted average cost of capital).


In the summary tab you can see a high-level report with the main metrics and value drivers of the model. It can be readily printed on one page for your convenience.


Calculations: this is where all calculations are performed. The revenues are calculated based on the various revenue streams and by deducting the operating costs adjusted for inflation the operating profit is resulting. Based on the assets financed and the gearing of the financing the interest and depreciation are occurring. By using the working capital assumptions, the impact of the business cycle is presented. Finally, depending on the level of the investment considered the relevant debt financing is calculated (Long term debt and overdraft).


In the Outputs tab: everything is aggregated here into the relevant statements: profit and loss, balance sheet and cash flow.


Moving to the Valuation tab, a valuation is performed by using the free cash flows to the firm and then a series of investment metrics are presented (Net Present Value, Internal Rate of Return, Profitability Index, Payback Period, Discounted Payback Period, Sensitivity Analysis).


In the Graphs tab: Various graphs present the business metrics, revenues, operating costs, and profitability. Then multiple charts present the working capital, debt & equity along with cash, assets, and cash flows which results in a valuation on a project basis as well as on an equity basis together with the feasibility metrics.


In the Break-Even tab, you can find a break-even analysis and see how many sales you need to break even.

Checks: A dedicated worksheet that makes sure that everything is working as it should!

Important Notice: Yellow indicates inputs and assumptions that the user can change, blue cells are used for called up cells, and white cells with black characters indicates calculation cells.


More from this collection