Welcome to our website!
Cart 0

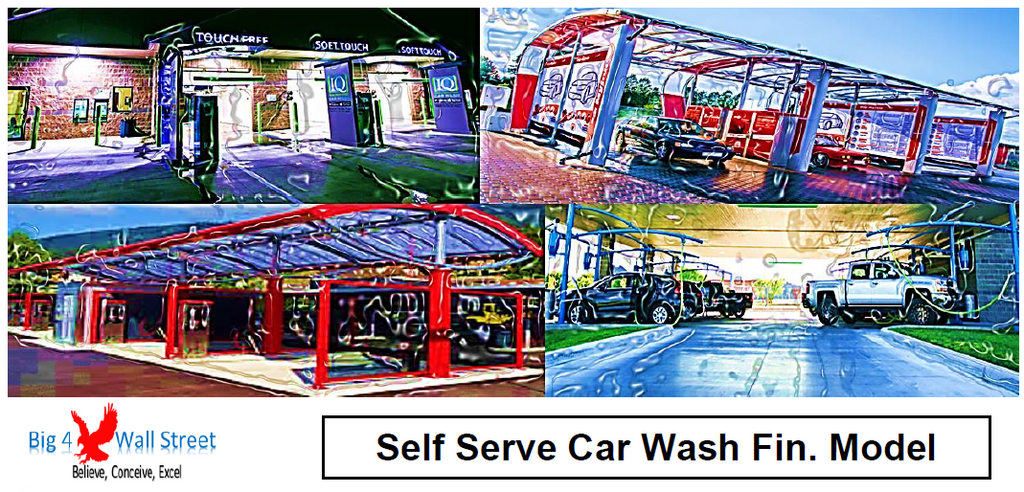
Self Serve Car Wash Financial & Business Plan

€299.00 €400.00

Self-Serve Car Wash Financial Model and Plan consists of a financial model in excel and a short business plan in PowerPoint for the opening of a new car wash self serve business.

The model generates:

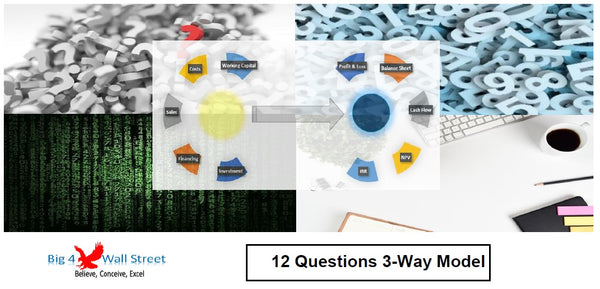
1) Three financial statements (profit & loss, balance sheet and cash flow)

2) Valuation using free cash flows

3) Returns per investor based on hurdle rates

4) Actuals vs plan tracking, various charts

5) Breakeven analysis

6) Margins, ratios, and feasibility metrics

7) Three scenarios to stress test the plan in the "Scenarios" tab

8) Executive Summary tab which aggregates the most important metrics of the model.

So, a quick overview of the model, in the contents tab you can see the structure of the model and by clicking on any of the headlines to be redirected to the relevant worksheet.

On the timing tab you can feed the general information for the model such as: model name, responsible, timeline of the model and date and currency conventions.

Additionally, there is a description of the color coding of the model in the same tab. Inputs are always depicted with a yellow fill and blue letters, call up (that is direct links from other cells) are filled in light blue with blue letters while calculations are depicted with white fill and black characters.

There is also a color coding for the various tabs of the model. Yellow tabs are mostly assumptions tabs, grey tabs are calculations tabs, blue tabs are outputs tabs (that is effectively results or graphs) and finally light blue tabs are admin tabs (for example: the cover page, contents, and checks).

There are 4 tabs where the user input is needed: "Timing", "Sales & Capex (Plan)", "Other Inputs (Plan)", "Inputs (Actuals)", "Scenarios", "Actual vs Plan (Graphs)". The user needs to fill the yellow cells in each of these tabs, all the remaining tabs are calculated automatically.

In the Sales & Capex (Plan), the user fills the number of cars washed per day, the monthly seasonality, the ramp up period, as well as bays per location assumptions. The user then sets the spend per car wash and the relevant price growth. In the same tab the user inputs the investment needs for the car wash bays, the initial working capital, renovations, refurbishments, as well as the depreciation in years of each of these assets.

In the Other Inputs (Plan), the user needs to set the variable costs, labor costs (headcount per month and their salary costs), other costs, fixed costs (such as rent, utilities, insurance, professional services, stationary, consumables, third party fees) , as well as working capital (inventory, receivables, payables), financing (debt gearing, financing costs, repayment years). The financing options for the project include equity funding from investors and debt financing (amortizing, bullet, or interest only). Afterwards the user can set the taxation and valuation assumptions.

In the Inputs (Actuals), the user must input the actual figures for revenues, gross profit, EBITDA and net income. This will feed the Actual vs Plan (Graphs) and compare the actual performance with the forecasted plan, and their deviations in both absolute terms and relative terms as a percentage.

All the remaining tabs are automatically calculated from the assumptions that the user has set. The resulting tabs are the three financial statements such as the profit and loss, balance sheet and cash flow on a monthly and yearly basis, the valuation of the business and its feasibility metrics (such as Net Present Value, Internal Rate of Return and Cash on Cash multiple), various KPIs and ratios, Investor Returns (where the user can set the hurdle rates and distribution split between equity investors) and Break-Even Analysis (Break Even Sales, Break Even Volume and Margin of Safety), all the charts are in the "Graphs" tab (Business and Profit and Loss Charts, Balance Sheet Graphs, and Cash Flow and Valuation Charts). The user can also stress test his plan in the "Scenarios" tab and by selecting one of the three scenarios to see the impact on his plan. Finally the most important financial and business metrics are aggregated in the Executive Summary tab.

Finally, the checks tab where the most critical checks are aggregated. Whenever you see an error message in any page, you should consult this page to see where the error is coming from.

Moving on to the Business Plan PowerPoint file now, which consists of 21 pages and can be used for a quick presentation of your plan. The PowerPoint file is editable and can be amended. The charts that are present in the PowerPoint file are coming from the excel file that accompanies the PowerPoint file (the charts and tables have been linked to the accompanying excel file).

The Business Plan is separated into 9 sections: Executive Summary, Mission, Objectives and Keys to Success, Funding, Value Proposition, Market Analysis, Strategy, Sales Forecast and Milestones, Management and Key Personnel, Financial Plan and finally Appendices.

All appendices’ tables (major assumptions, personnel plan, and detailed financial plan) have been retrieved from the financial model and have been pasted as pictures into the presentation. When opening the Power Point you will be prompted to update the links to the accompanying excel file.


More from this collection