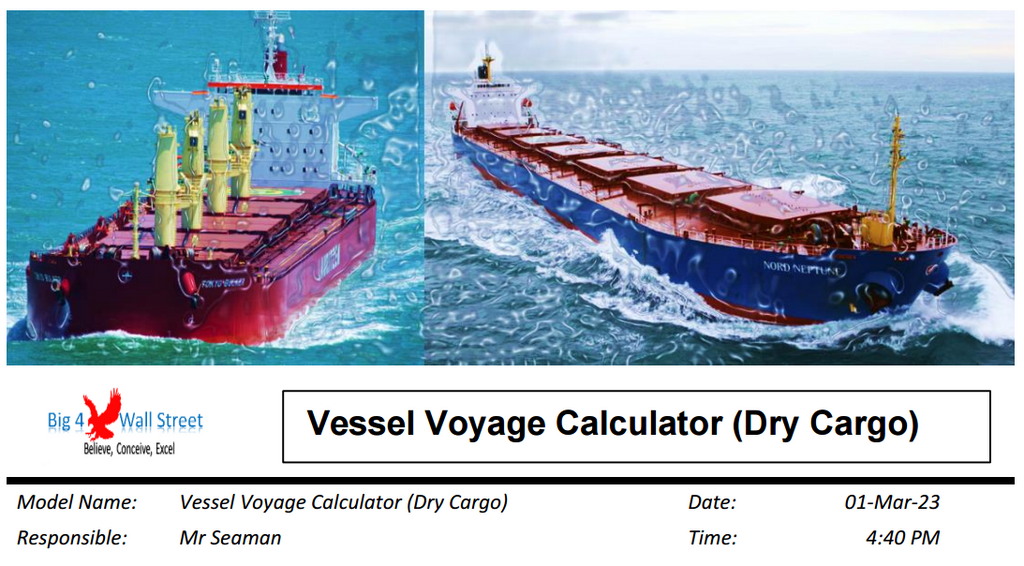
Vessel Voyage Calculator (Dry Cargo)
This financial model allows the user to calculate and compare 3 different vessel voyage estimations for dry cargoes ships.
Voyage Estimation is the calculation of the profit or loss that a ship will make from a proposed voyage charter. It involves analyzing the costs of chartering the vessel, fuel, port charges, cargo loading and unloading fees, and other related expenses. The ship owner or charterer then compares the estimated cost of the voyage with the expected revenue from the charter to determine the potential return for the voyage.
This financial model template will enable you to:
- Estimate up to 3 different voyage routes and compare them in terms of various operational and profitability metrics.
- Calculate the Gross Freight and Net Freight based on freight rates, commissions, and brokerage.
- Calculate fuel expenses based on vessel speed, vessel consumption at sea, during transits, and in port, as well as fuel prices.
- Calculate days for sea traveling, and loading / discharging, canal transit, bunkering, as well as bad weather allowance.
- Set various expenses related to port disbursements, hiring costs, and other expenses related to the voyage.
- Check the profitability of each voyage in terms of operating and net profit, as well as in terms of gross daily, net daily and TCE.
- Perform sensitivities on profit metrics and assess the risk of the voyage.
- Get an executive summary for each voyage.
- Present through a series of charts the performance and profitability of each voyage.
So, a quick overview of the model, in the contents tab you can see the structure of the model and by clicking on any of the headlines to be redirected to the relevant worksheet.
On the timing tab you can feed the general information for the model such as: model name, responsible, timeline of the model and date and currency conventions.
Additionally, there is a description of the color coding of the model in the same tab. Inputs are always depicted with a yellow fill and blue letters, call ups (that is direct links from other cells) are filled in light blue with blue letters while calculations are depicted with white fill and black characters.
There is also a color coding for the various tabs of the model. Yellow tabs are mostly assumptions tabs, grey tabs are calculations tabs, blue tabs are outputs tabs (that is effectively results or graphs) and finally light blue tabs are admin tabs (for example: the cover page, contents, and checks).
Moving on to the inputs tab, you can adjust the various assumptions of the model based on the specifications and requirements of the voyage. The user can adjust the freight rates, commissions, brokerage, and other costs. You can set the rounding factor to 0,1 or 2 with 0 being the most conservative option in terms of calculations.
The cargo capacity can also be set, along with the constants. Then the user can set the vessel speed and consumption at sea, during canal transit and in port. The fuel prices can also be set accordingly for each available bunkering port.
Moving to the next set of assumptions, the user can set the loading and discharging ports along with their respective rates, and terms applied.
Moving forward the user can set the various legs of the voyage (up to 3 legs), and set the following parameters: from / to, ballast / laden, and nautical miles (where applicable). The user can also set the days spent in the bunkering port, in canal transits, and in adverse weather conditions.
Then the user can set the disbursements at each port, as well as canal transit fees, etc
Finally in the sensitivities the user can set the rate per ton, and the gross hire per day, or the commissions percentage.
The above assumptions can be set for each of the 3 voyages in the tabs (1 Inputs, 2 Inputs and 3 Inputs).
On the calculation tab, all calculations are performed instantly without the need of an excel macro. The calculations follow the same logical flow as the in the inputs tab. As already mentioned, no inputs from the use are needed here, as all the inputs are fed in the yellow cells on the inputs tab only.
On the executive summary tab, the user can see the main assumptions and outputs of the model such as general assumptions, voyage assumptions, bunkering and other assumptions, costs summary, financials in USD and in USD per day, and sensitivities on daily profit metrics, and on absolute profit metrics.
In the Compare tab the user can compare the 3 voyages and see on the columns to the right the best and worst voyage based on each parameter. Additionally, the user can select 2 voyages and direct compare them by observing the percentage differences and the absolute differences of each metric.
Finally, the checks tab where the most critical checks are aggregated in this page. Whenever you see an error message in any page, you should consult this page to see where the error is coming from.


