Telecoms Financial Model
Telecom Financial Model presents the case of an already operating business in the telecom sector (mobile communications, internet and entertainment services). The model generates the three financial statements, a summary page, and a valuation (both a DCF and a transactions approach) as well as graphs. The financing options for the project include a standard long term loan, as well as an overdraft facility and of course equity funding from investors.
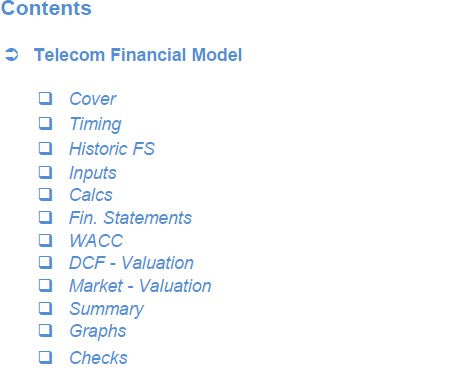
So a quick overview of the model, in the contents tab you can see the structure of the model and by clicking on any of the headlines to be redirected to the relevant worksheet.
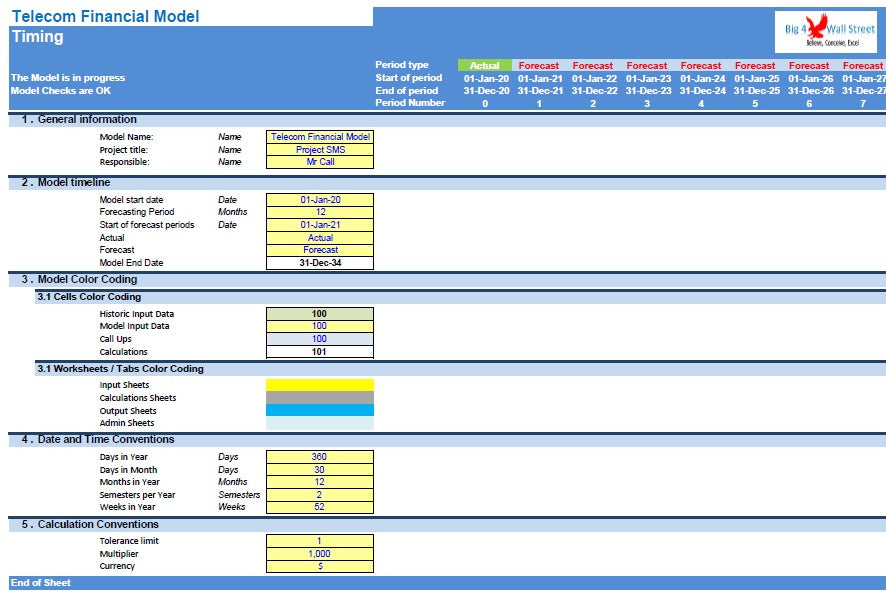
On the manual tab you are able to feed the general information for the model such as: project name & title, responsible, timeline of the model and date and currency conventions.
Additionally there is a description of the color coding of the model in the same tab. Historic inputs are presented in light green fill with black letters, forecast inputs are always depicted with a yellow fill and blue letters, call up (that is direct links from other cells) are filled in light blue with blue letters while calculations are depicted with white fill and black characters.
There is also a color coding for the various tabs of the model. Yellow tabs are mostly assumptions tabs, grey tabs are calculations tabs, blue tabs are outputs tabs (that is effectively results or graphs) and finally light blue tabs are admin tabs (for example: the cover page, contents and checks).
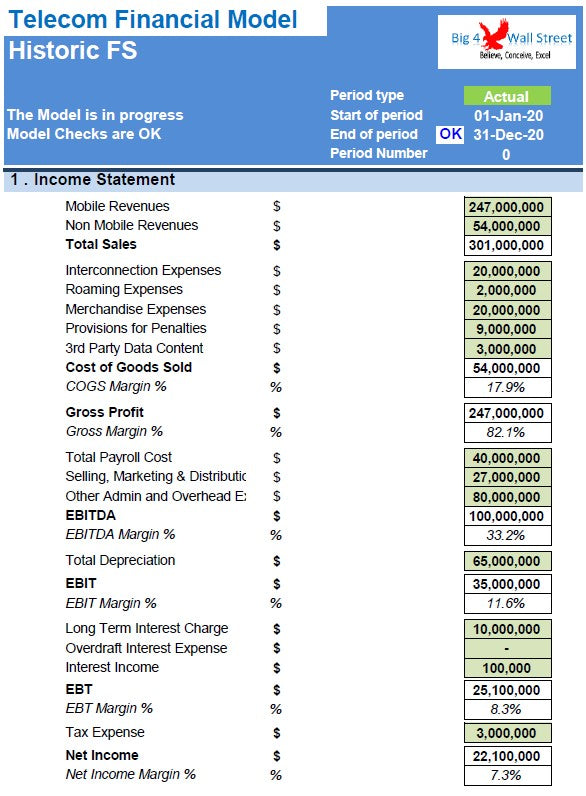
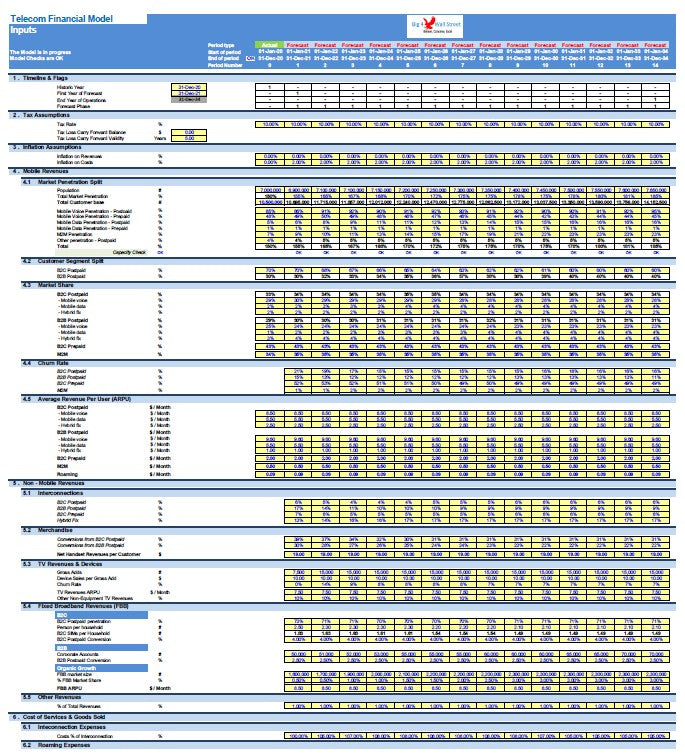
Moving on to the "Historic FS" & "Inputs", in these tabs, the user needs to adjust the business drivers in the yellow cells for forecast inputs and light green cells for historic inputs.
In the "Historic FS" tab, the user needs to fill the light green cells both for the income statement and the balance sheet. The balance sheet is set to be balanced automatically through retained earnings.
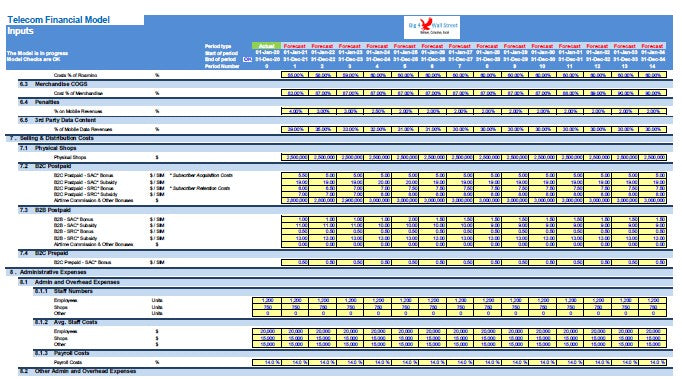
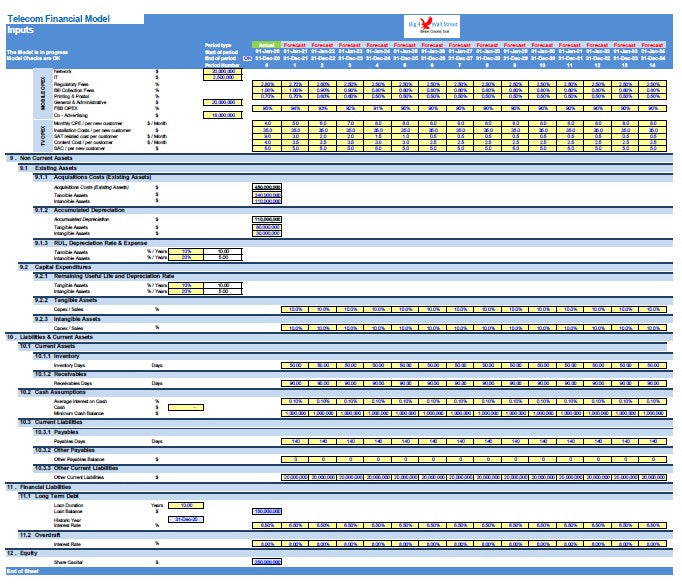
In the "Inputs" tab, the revenue drivers start with a top down approach from the population targeted and the mobile penetration as well as the market share, churn rates and average revenues per user (ARPU) for each revenue stream (B2C, B2B, B2C Prepaid, M2M). Additional non mobile revenue drivers include merchandise, TV revenues and devices, fixed broadband, and other revenues. The costs to support the revenue drivers of the business are split into cost of services & goods sold and sales and general administrative expenses. Other drivers include receivables days, payable days, inventory days and income tax. Additional assumptions include: depreciation period in years (for both the initial investment and subsequent capital expenditures), debt gearing, interest on loans (term loan, overdraft), and share capital.
Calculations: this is were all calculations are performed. The revenues are calculated based on the previous inputs and the growth rates, and by deducting the operating costs, the operating profit is resulting. Based on the assets financed and the gearing of the financing the interest and depreciation are occurring. By using the working capital assumptions the impact of the business cycle is presented. Finally depending on the existing debt financing and forecast assumptions the loan balances are calculated (Term loan, overdraft).
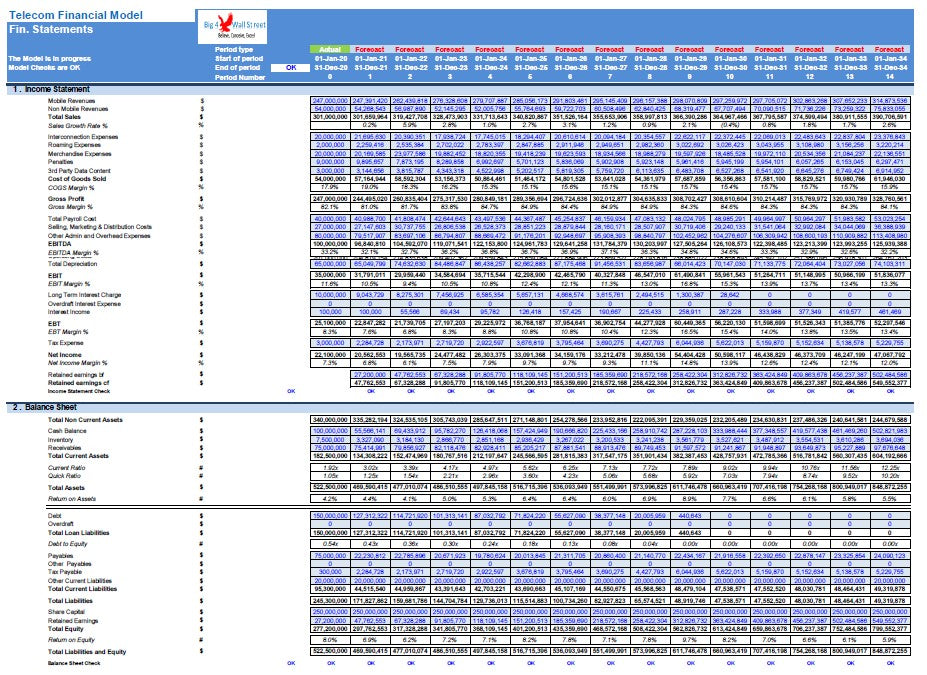
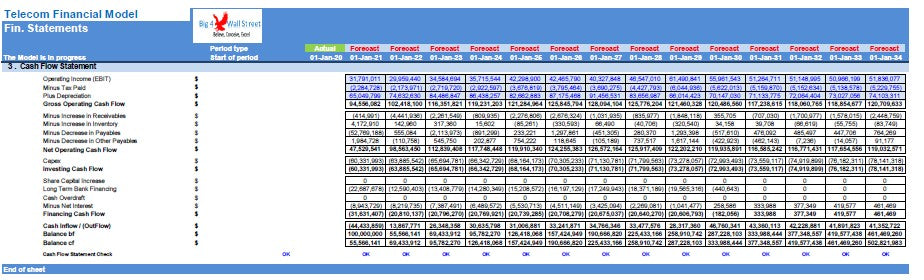
In the Financial Statements tab: everything is aggregated here into the relevant statements: profit and loss, balance sheet and cash flow on a yearly basis.
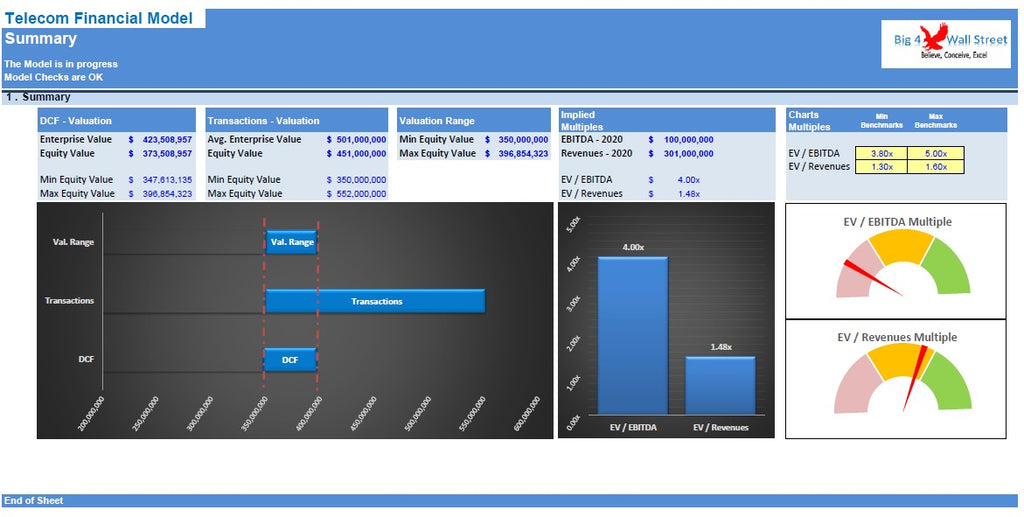
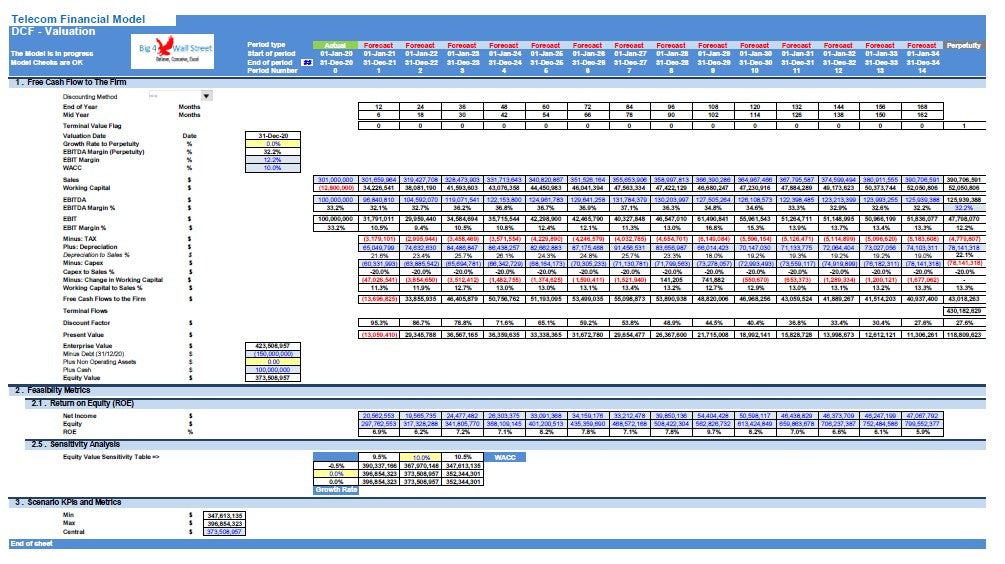
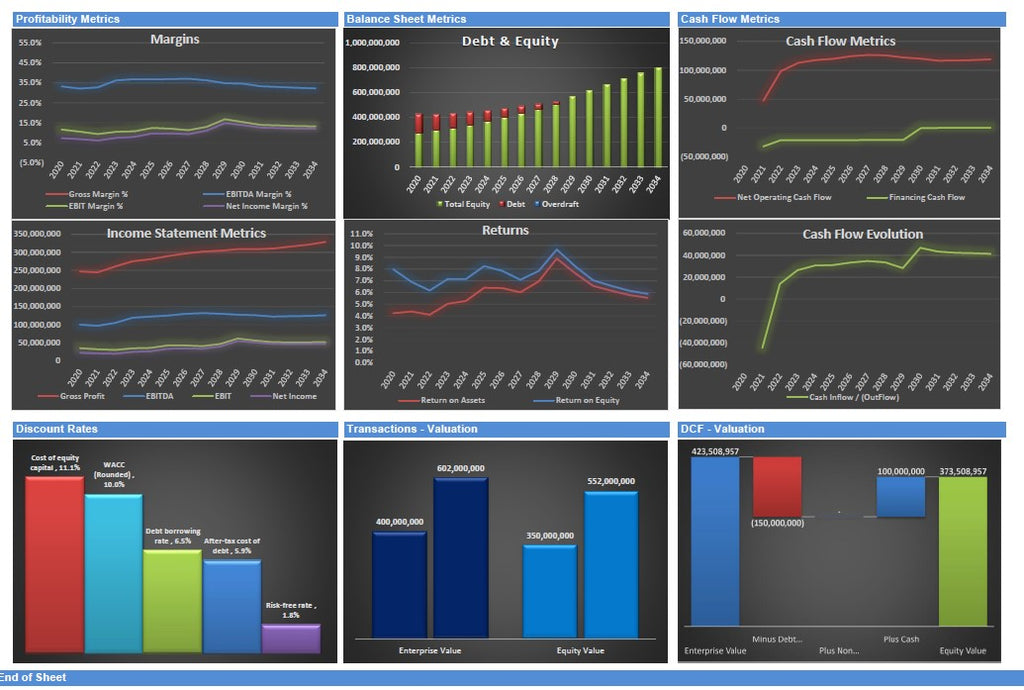
Moving to the DCF-Valuation tab, a free cash flow to the firm valuation is performed leading to an enterprise value and an equity value. Additionally a sensitivity analysis is performed on the equity value of the business by using the discount rate and the growth rate to perpetuity as sensitivity parameters.
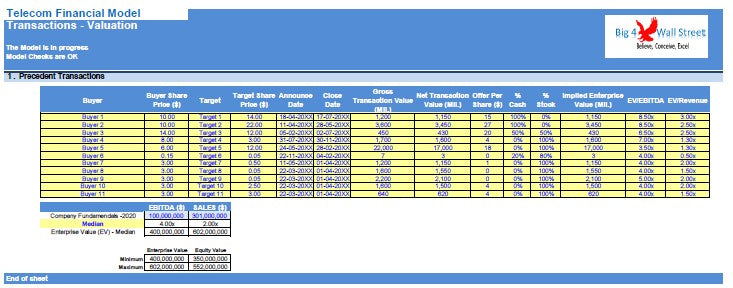
In the Transactions-Valuation tab, a valuation is performed based on the resulting EV/EBITDA and the EV/Revenues from precedent transactions.
In the summary tab you are able to see a high level valuation summary which can be readily printed on one page for your convenience.
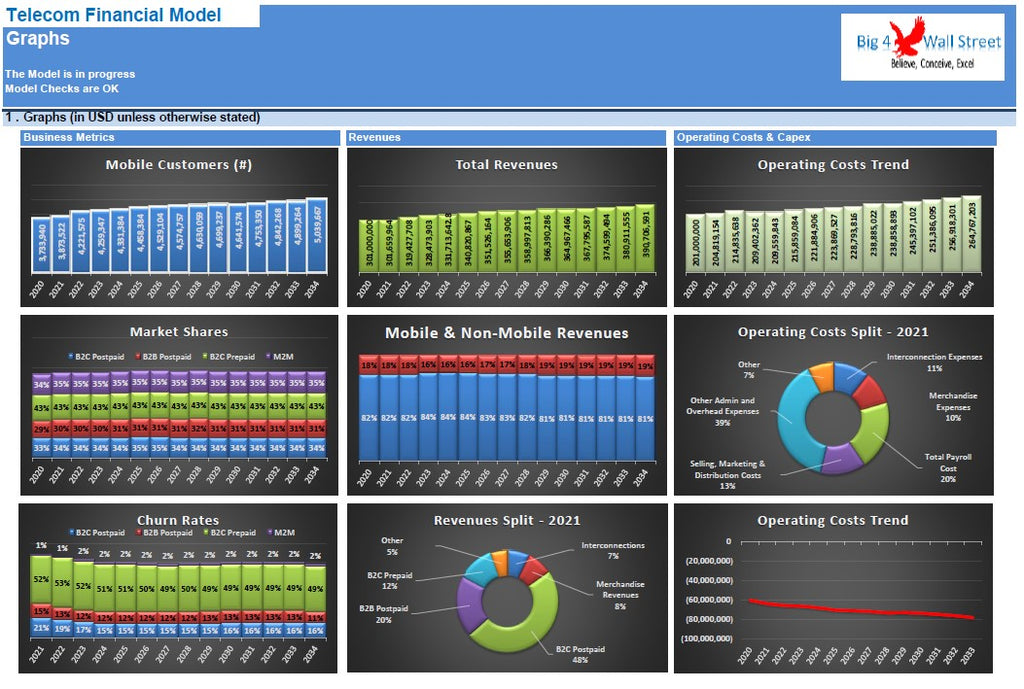
In the Graphs tab: Various graphs present the business metrics, revenues, investment & operating expenses, profitability metrics, additionally balance sheet and cash flow metrics, and we finish with discount rates, and valuation graphs.
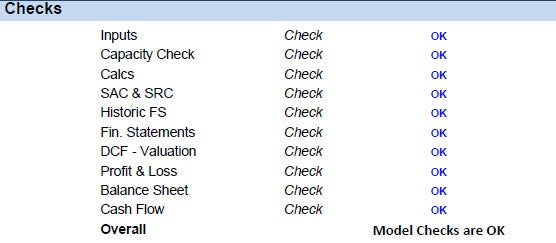
Checks: A dedicated worksheet that makes sure that everything is working as it should!
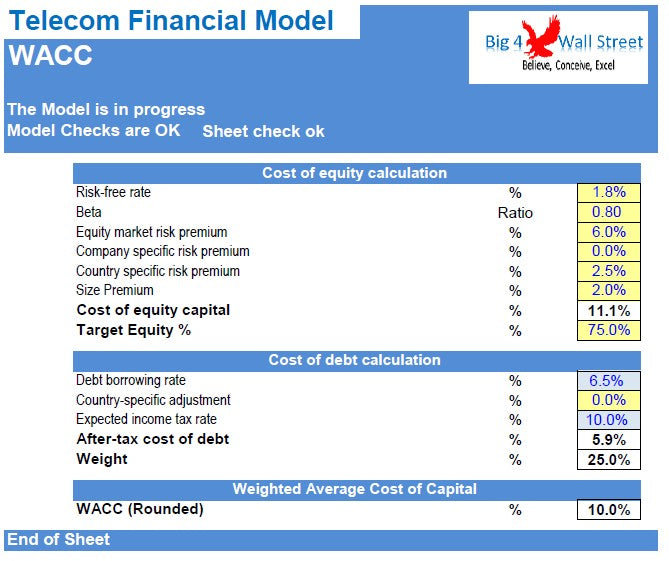
Important Notice: Yellow indicates inputs and assumptions that the user is able to change, blue cells are used for called up cells, and white cells with black characters indicates calculation cells.