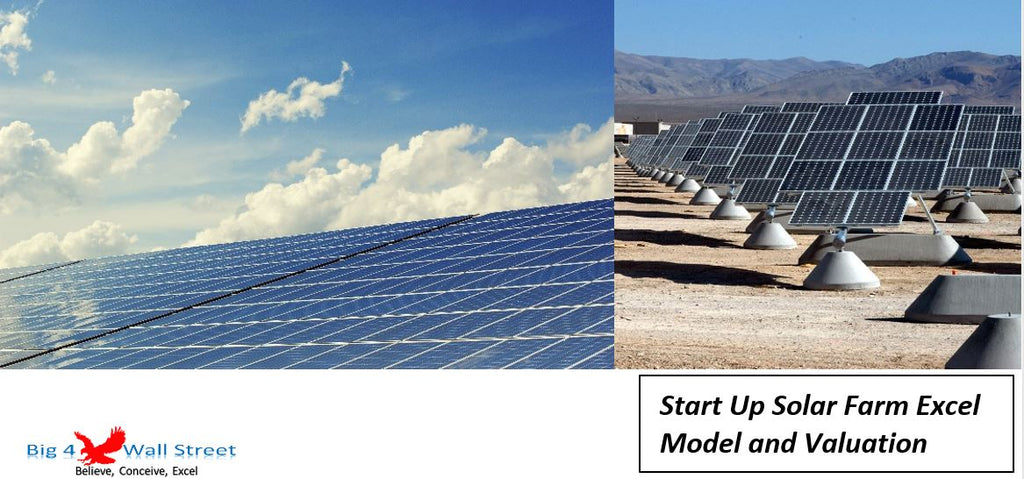
Start Up Solar Farm Excel Model and Valuation
Start Up Solar Farm Excel Model presents the business case of an investment in the construction of a solar farm and the sale of the energy generated from it. The model generates the three financial statements as well as the cash flows and calculates the relevant metrics (cash on cash, IRR, payback period, shareholder value, DSCR, LLCR). The financing options for the project include a construction loan, a VAT facility as well as an overdraft facility and of course equity funding from investors.
The model structure is as follows:
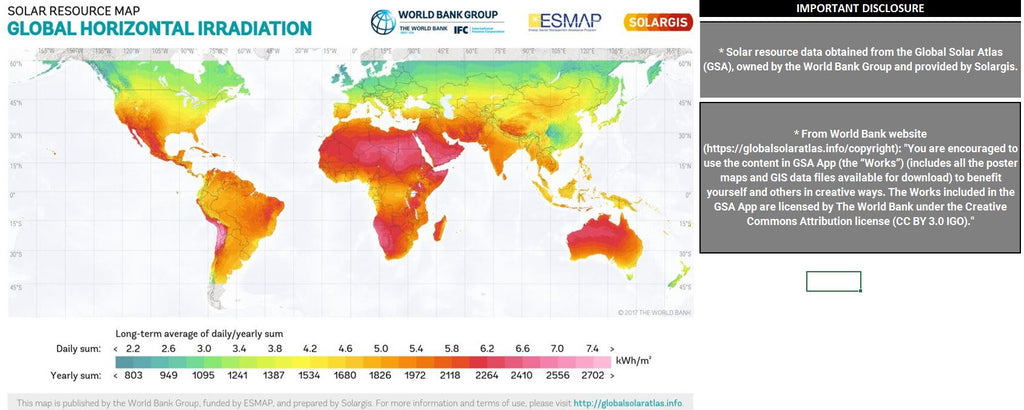
Map Tab: presents on a global scale the horizontal irradiation in order for the user to be able to approximate an estimate of the irradiation for his region (" Solar resource data obtained from the Global Solar Atlas (GSA), owned by the World Bank Group and provided by Solargis" under the Commons Attribution license)
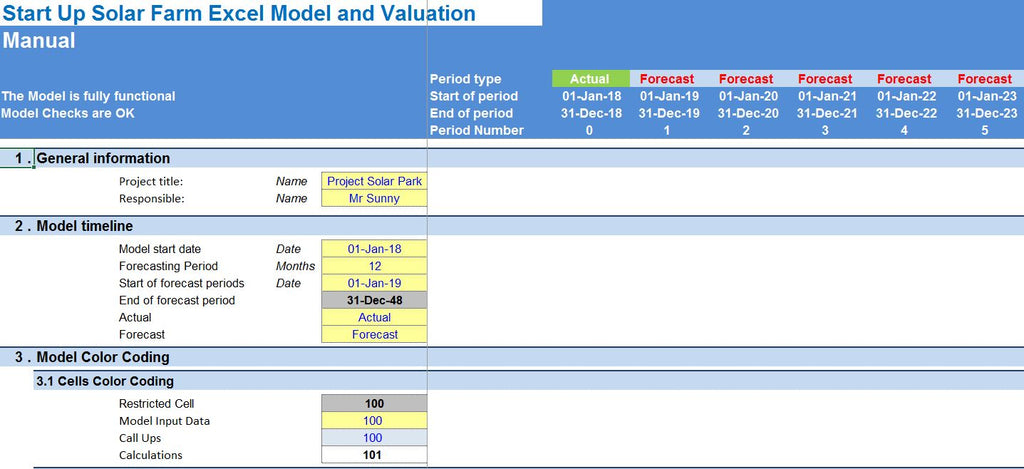
Manual Tab: main conventions used in the model.
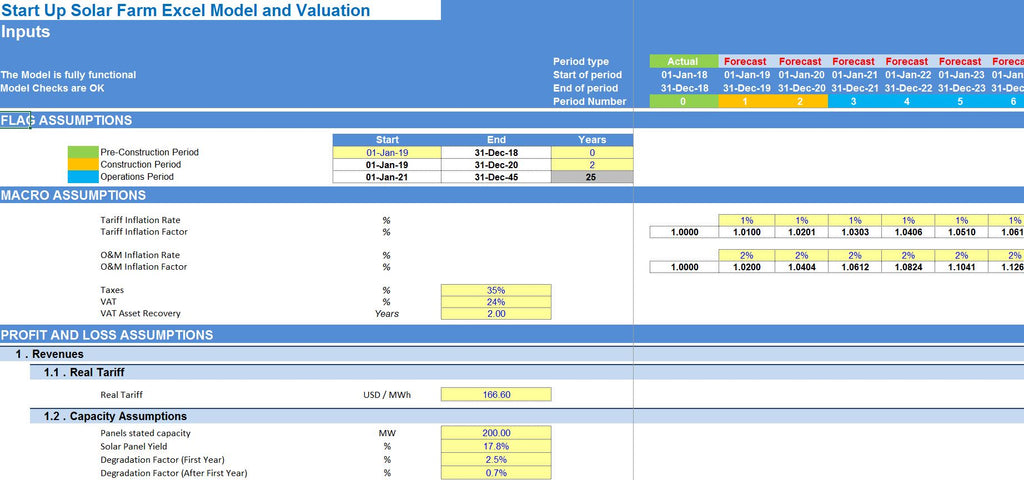
Inputs Tab: (in yellow whatever can be amended as an assumption): detailed inputs for revenues (tariffs, capacity assumptions, and other capacity utilization parameters such as pre photovoltaic and system & thermal losses), costs (maintenance, insurance, land leasing, system and transmission costs, contingency costs), working capital (receivables, payables, cash and overdraft), fixed assets and capex (including a construction schedule, VAT & Depreciation applicability), financing (long term debt and related VAT facility), equity financing as well as valuation assumptions (such as discount rates used).
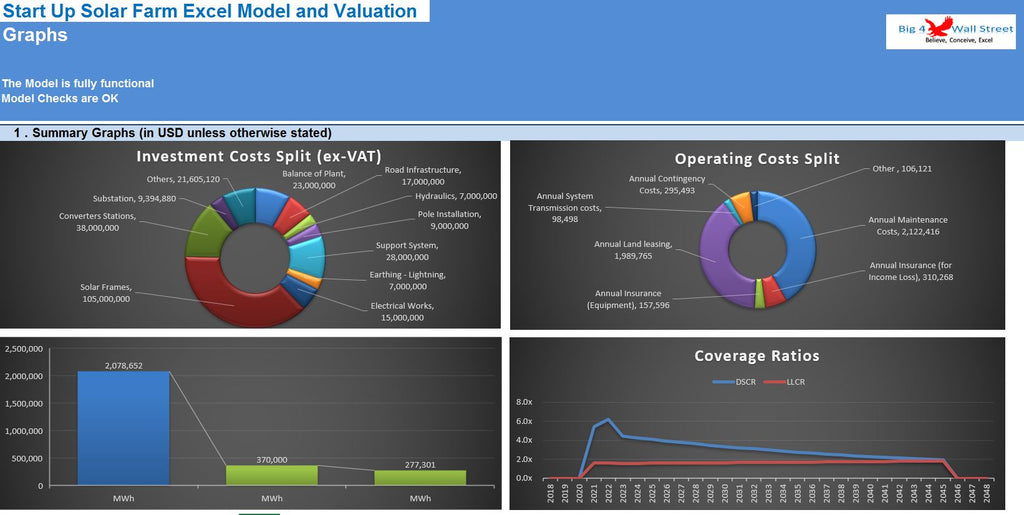
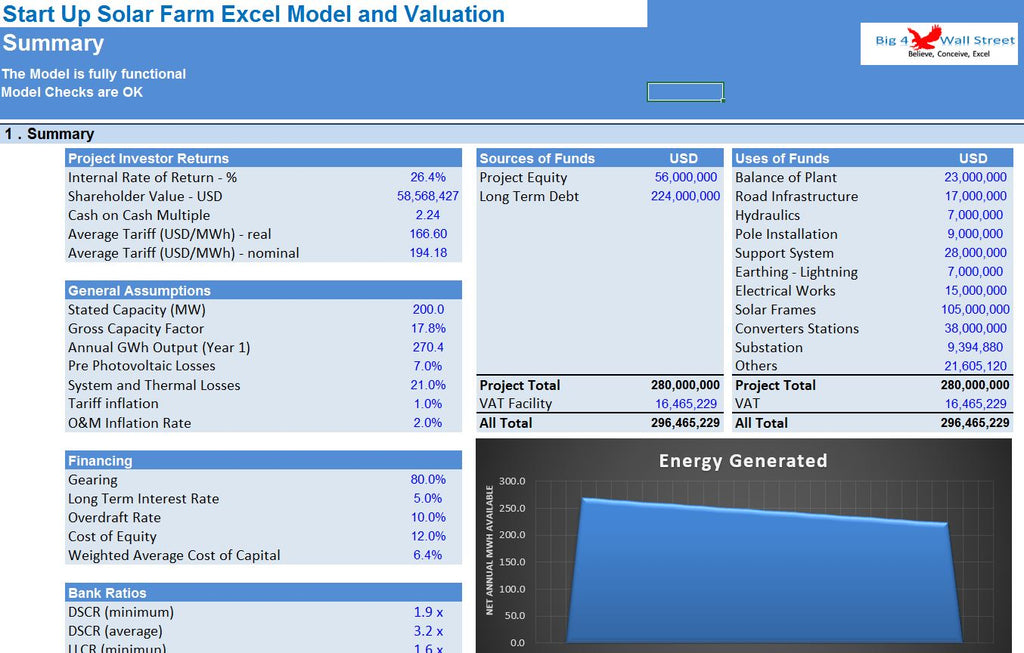
Summary Tab: Since the model does not use any macros, the summary page (1 page ready to be printed) is instantly updated with the main output metrics of the model such as IRR, Shareholder Value, Cash on Cash Multiple, Sources and Uses, General Assumptions regarding the power generation including a relevant graph, DSCR, LLCR, and other financing assumptions.
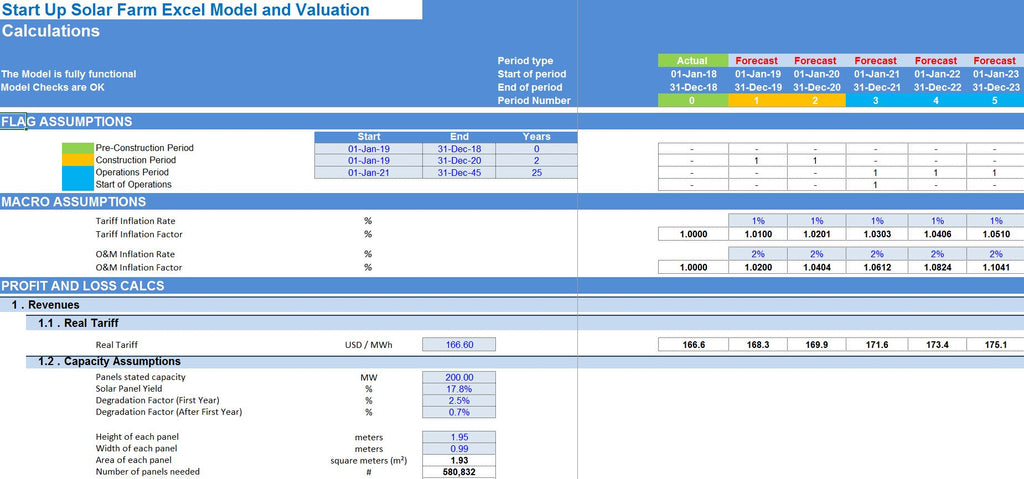
Calculations Tab: this is were all calculations are performed. The energy production is calculated and by applying the relevant tariffs adjusted for inflation and deducting the operating costs adjusted for inflation the operating profit is resulting. Based on the assets financed and the gearing of the financing the interest and depreciation are occurring. By using the working capital assumptions the impact of the business cycle is presented. Finally the sources and uses of funds are presented and the relevant debt financing is calculated (construction loan, VAT Facility and overdraft)
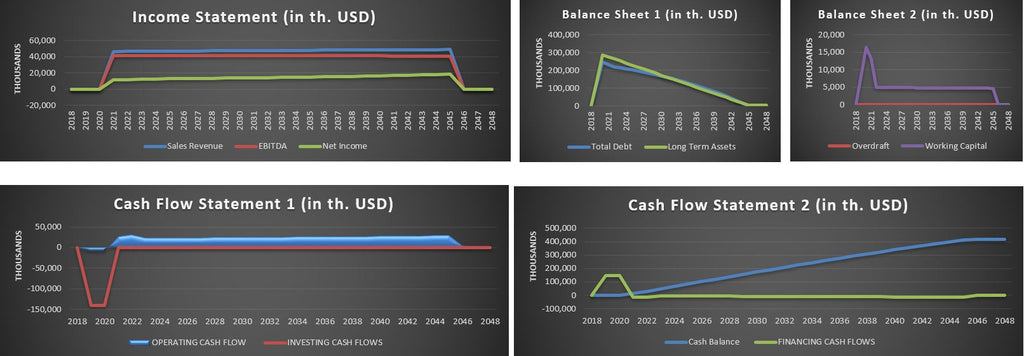
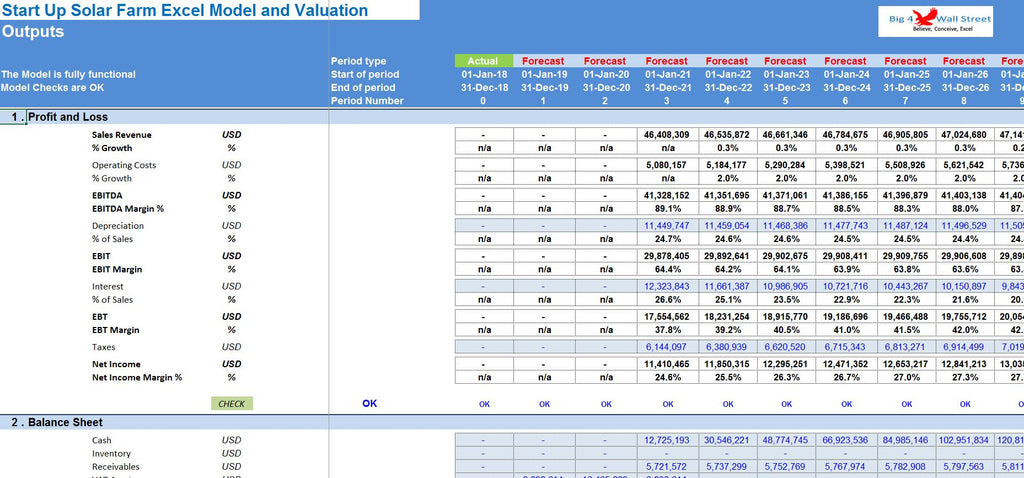
Outputs Tab: everything is aggregated here into the relevant statements: profit and loss, balance sheet and cash flow.
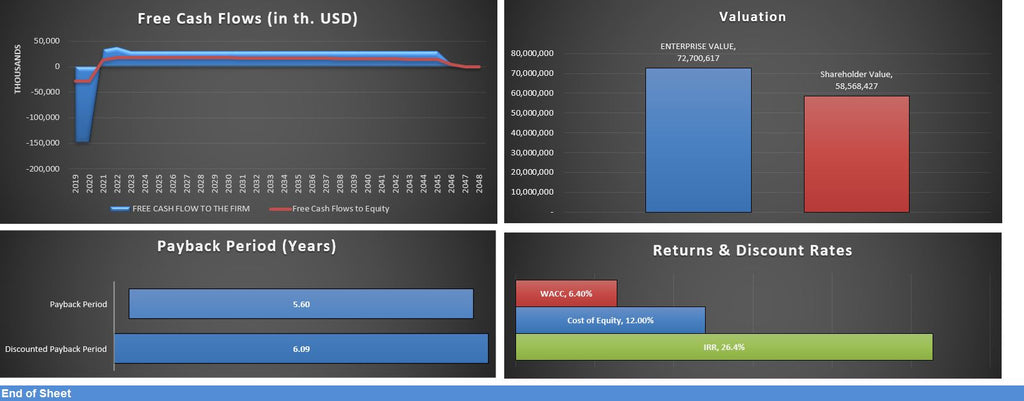
Graphs Tab: Various graphs present the investment & operating costs as well as the energy generation potential. Then multiple charts present the performance of the project from revenues to bottom line along with debt, assets, working capital and cash flows which results in a valuation on a project basis as well as on an equity basis together with the internal rate of return of the project and payback period metrics.
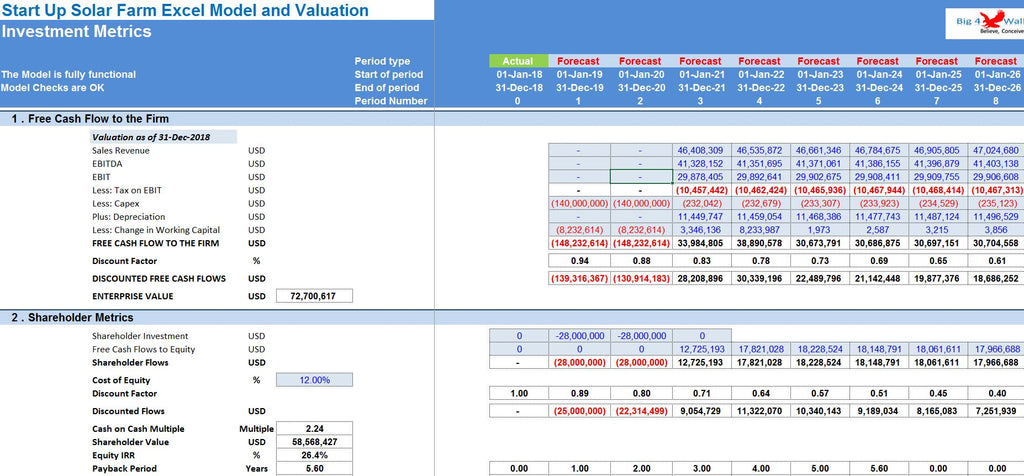
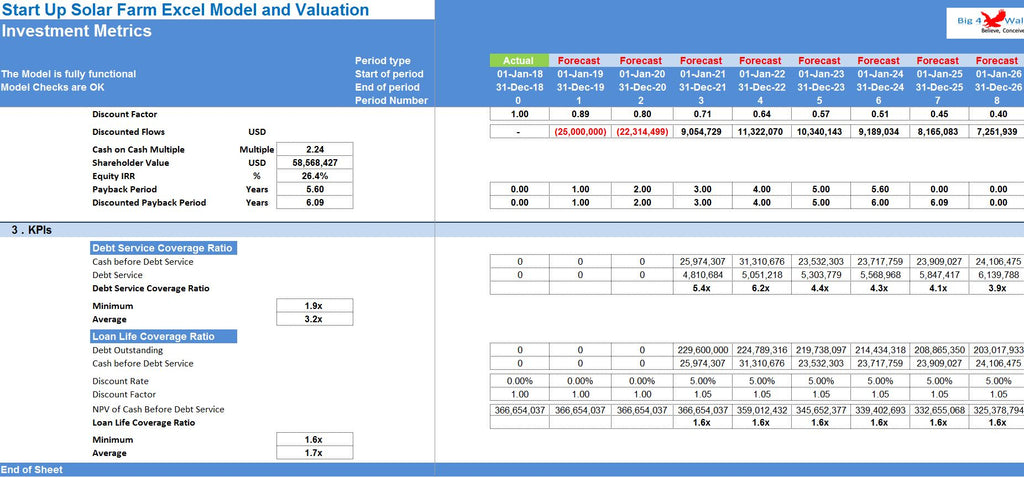
Investment Metrics: in order to see the detailed calculations for the above metrics (IRR, DSCR, LLCR, Valuations, Payback Period) you should consult this page for more information.
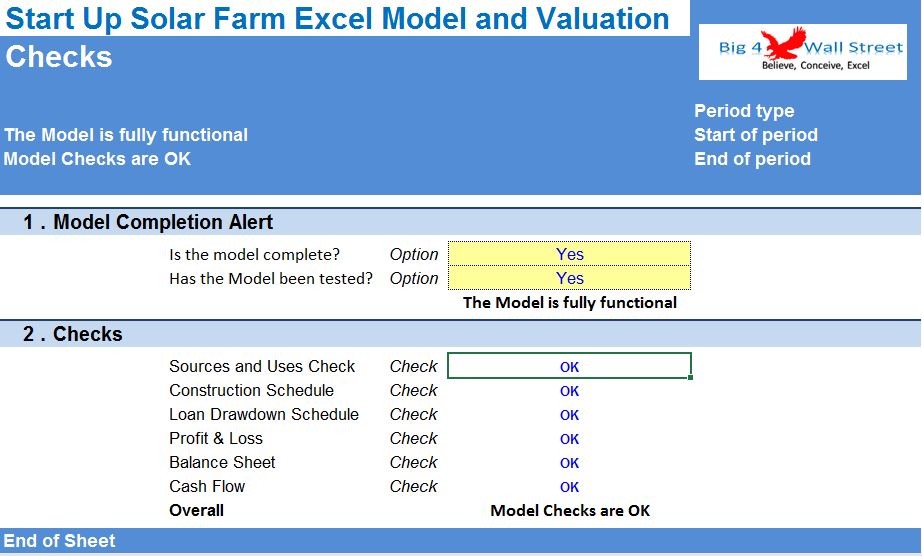
Checks: A dedicated worksheet that makes sure that everything is working as it should!
Important Notice: Yellow indicates inputs and assumptions that the user is able to change, blue cells are used for called up cells, and white cells with black characters indicates calculation cells. The model does not use a macro (all calculations are performed on the spot).