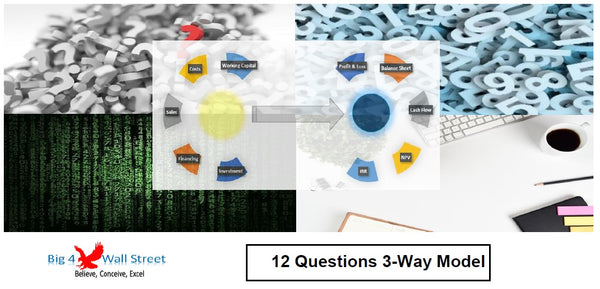


Inventory Dashboard Model
!! Kindly use the latest Microsoft Excel Version before purchasing the model, otherwise the dynamic dashboard will NOT work.!!
Inventory Dashboard Model generates a dynamic dashboard which can be filtered by Reporting Date, Materials, Products, and Country. The user needs to populate the purchase prices, the sales orders and the materials purchase orders.
The model is intended to be used in a specific calendar year and allow the user to enter actual data for prices, purchase and sales orders.
So, a quick overview of the model, in the Contents tab you can see the structure of the model and by clicking on any of the headlines to be redirected to the relevant worksheet.
On the General Assumptions tab, there is a description of the color coding of the model. Inputs are always depicted with a yellow fill and blue letters, while calculations are depicted with white fill and black characters. Grey cells are restricted cells and must not be modified.
A color coding is also applied to the various tabs of the model. Yellow tabs are mostly assumptions tabs, blue tabs are outputs tabs (that is effectively results or graphs) and finally light blue tabs are admin tabs (for example: the cover page, contents, and checks).
Additionally, in this tab, the user needs to set the Start Year and the model Frequency, the number of products and and their names (up to 10), the number of materials and their names (up to 10), the conversion (which is the material needs based on the sales performed), customers' names and countries (up to 10), as well as suppliers' names and countries (up to 10), finally the user needs to set the opening inventory qunatity and cost per material.
Moving on to the Prices tab: the user populates the prices per material for every period in the timeline.
Similarly in the Sales Orders tab, the user needs to fill the Order Date, Customer, Product and Sales Quantity. Once an an entry is made the rest of the table is updated accordingly. The sales quantity is converted to the materials used for this product based on the conversion table in the General Assumptions.
Finally, in the Purchase Orders tab, the user needs to populate the Purchase Date, Supplier, Raw Material Type, and Raw Material Quantity. The rest is auto-filled based on the entries the user makes. The delivery date is based on the delivery days for each supplier as set in the General Assumptions.
Once the General Assumptions, Prices, Sales Orders and Purchase Orders tabs have been filled, the user can consult the KPIs, and Dashboard tab.
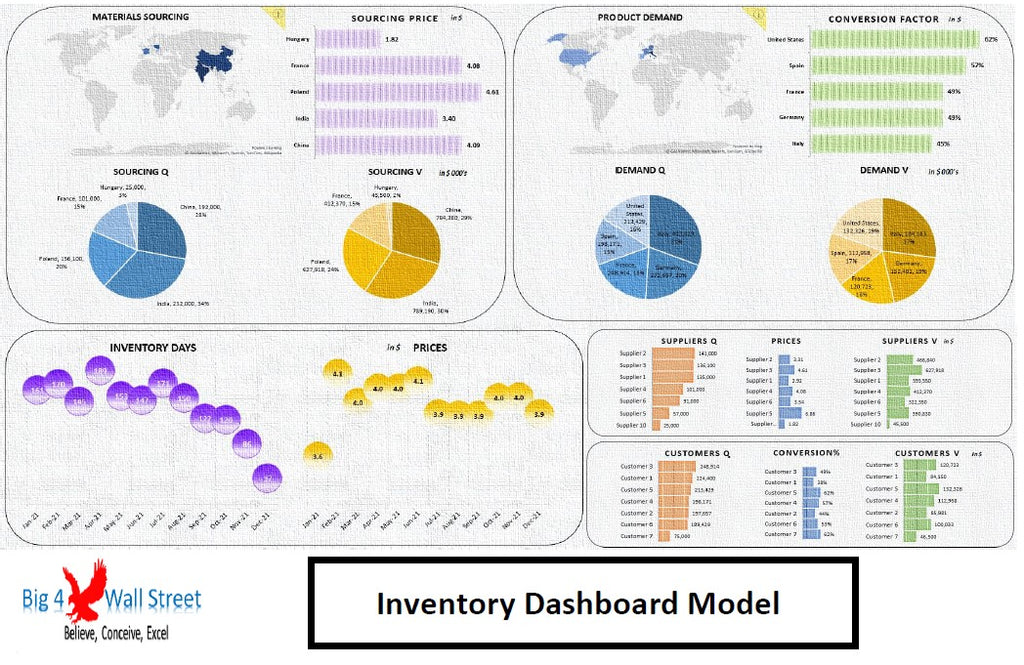
In the Dashboard tab, the user can select the yellow cells and change the following parameters: Reporting Date, Materials, Products, and Country. The corresponding charts (Inventory Summary, Purchases, Consumption, Inventory Days, Prices, Materials Sourcing, Product Demand, Suppliers' Summary and Customers' Summary are updated accordingly based on the user choices.
The detailed figures of the dashboard are presented in the KPIs tab. The user can navigate through the various sections of this tab: namely, Summary, Opening Balance, Purchases, Consumption, Ending Inventory, Sourcing & Demand, Prices and Inventory Days.
Finally, the checks tab where the most critical checks are aggregated. Whenever you see an error message in any page, you should consult this page to see where the error is coming from.