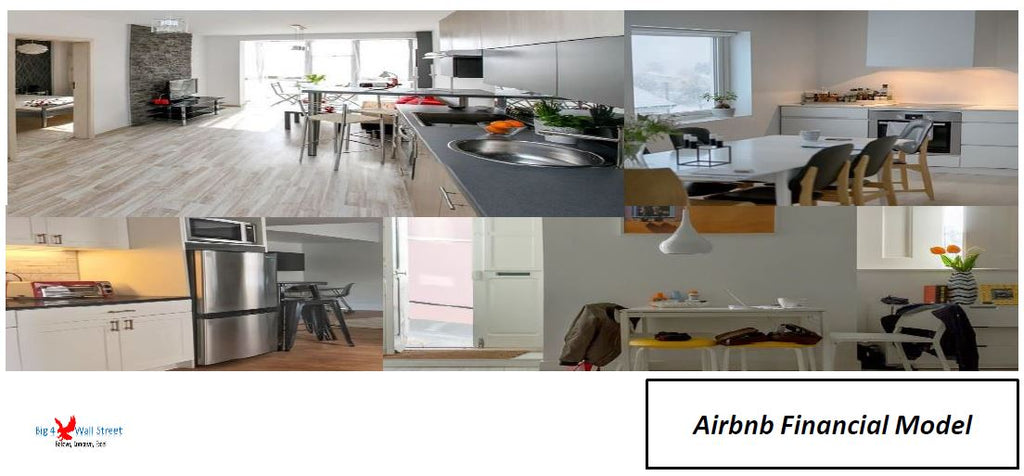
Airbnb Financial Model
Air BnB Financial Model Template presents the business case of the purchase of up to 5 properties with the intent of utilizing them as short term rentals to generate income. The model generates the three financial statements as well as the cash flows and calculates the relevant metrics (Net Present Value, Internal Rate of Return, payback period, cash on cash multiple, debt service coverage ratio, interest coverage ratio, debt yield etc...). The financing options for the project include a standard bank loan and of course equity funding from investors.
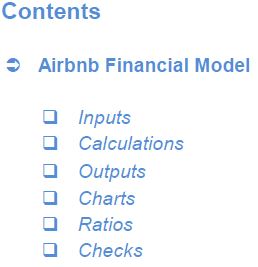
So a quick overview of the model, in the contents tab you can see the structure of the model and by clicking on any of the headlines to be redirected to the relevant worksheet.
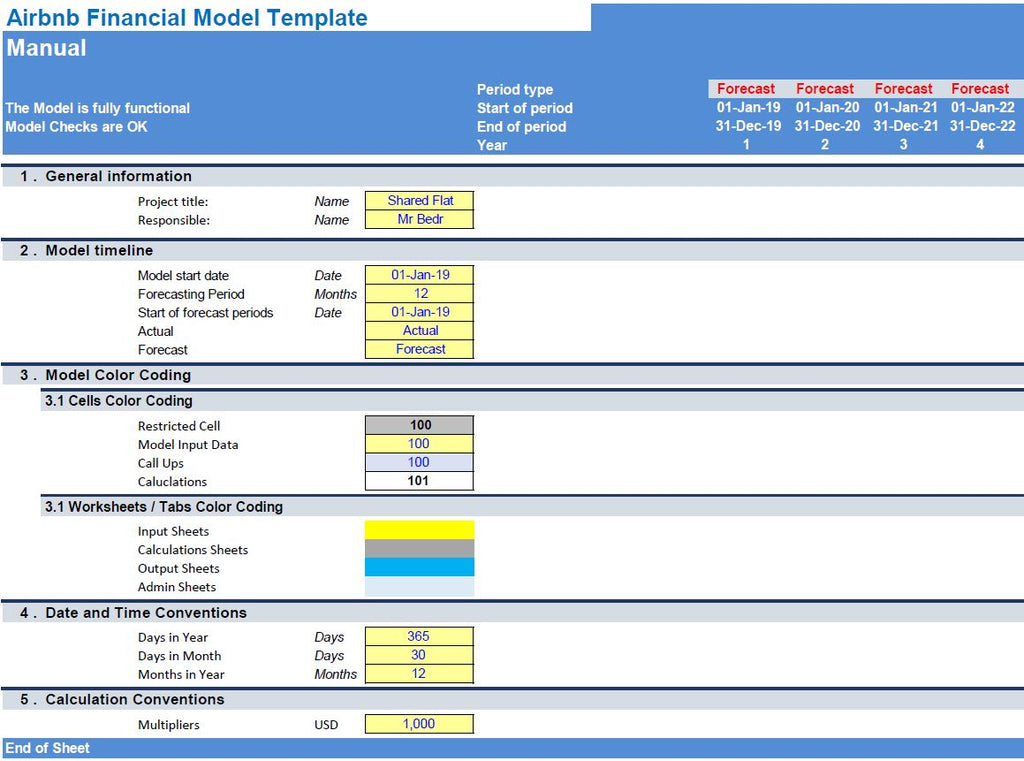
On the manual tab you are able to feed the general information for the model such as: project title, responsible, timeline of the model and date and currency conventions.
Additionally there is a description of the color coding of the model in the same tab. Inputs are always depicted with a yellow fill and blue letters, call ups (that is direct links from other cells) are filled in light blue with blue letters while calculations are depicted with white fill and black characters.
There is also a color coding for the various tabs of the model. Yellow tabs are mostly assumptions tabs, grey tabs are calculations tabs, blue tabs are outputs tabs (that is effectively results or graphs) and finally light blue tabs are admin tabs (for example: the cover page, contents and checks).
Guide Tab: this tab helps you to gain a grasp of the main value drivers of the model and understand the critical issues of the business.
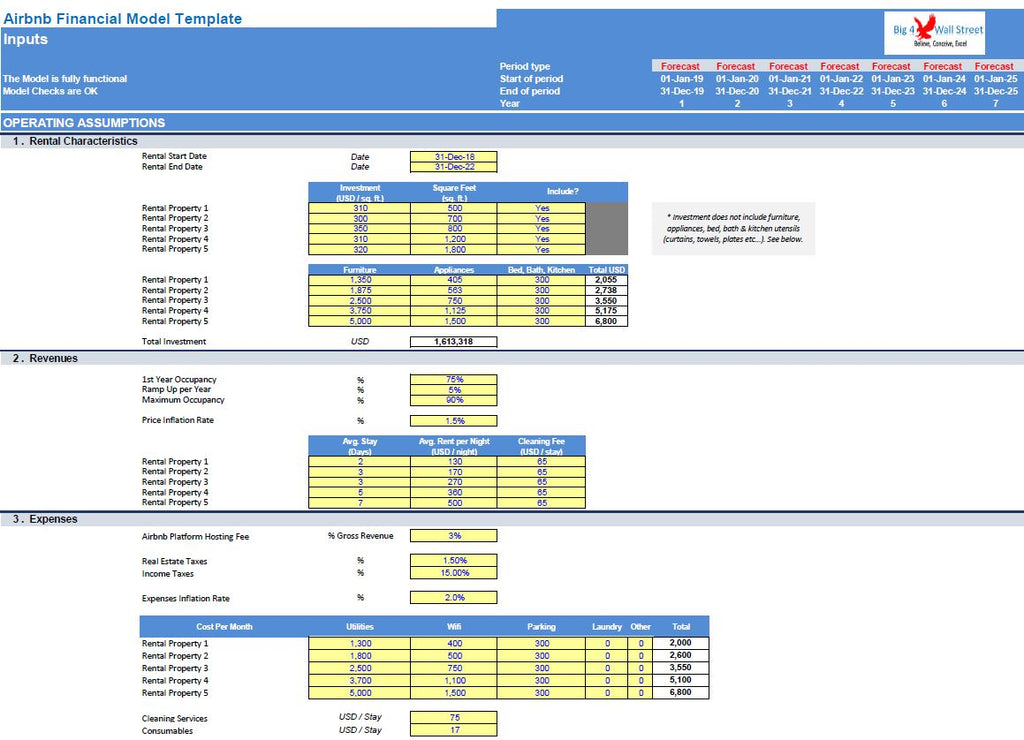
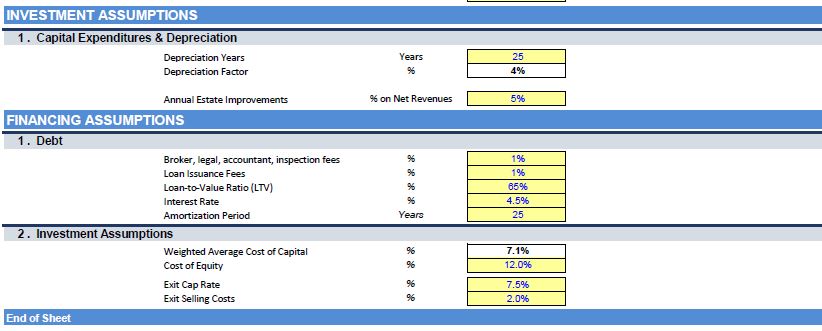
Moving on to the Inputs (in yellow whatever can be amended as an assumption): detailed inputs for revenues (average stays, average rent per night, occupancy rates), costs (utilities, wifi, parking, laundry, cleaning services, consumables, taxes, hosting fees), fixed assets and capex (property purchases and property improvements), equity financing as well as valuation assumptions (such as discount rates, loan to value ratio, cost of equity).
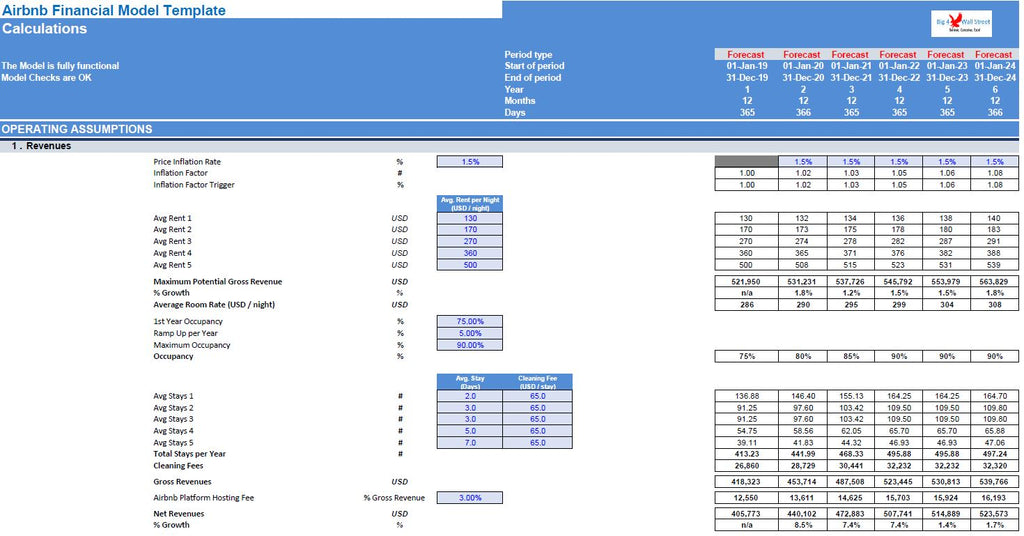
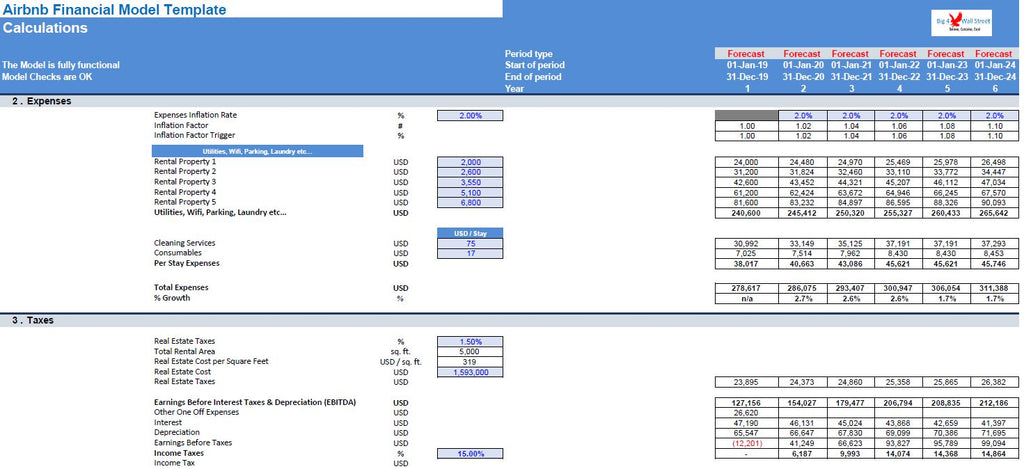
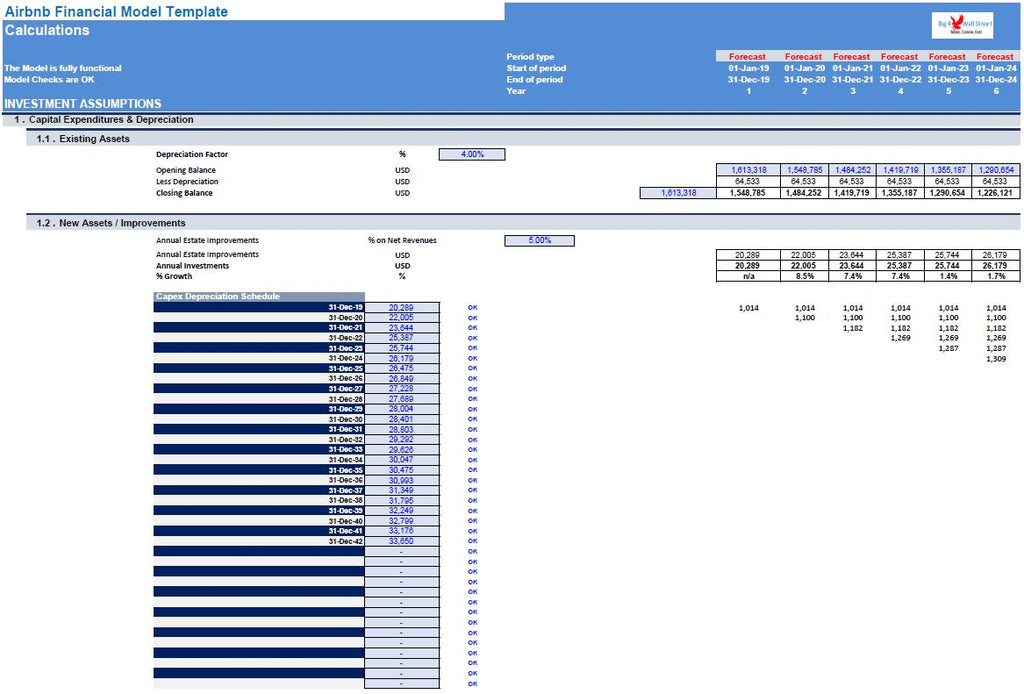
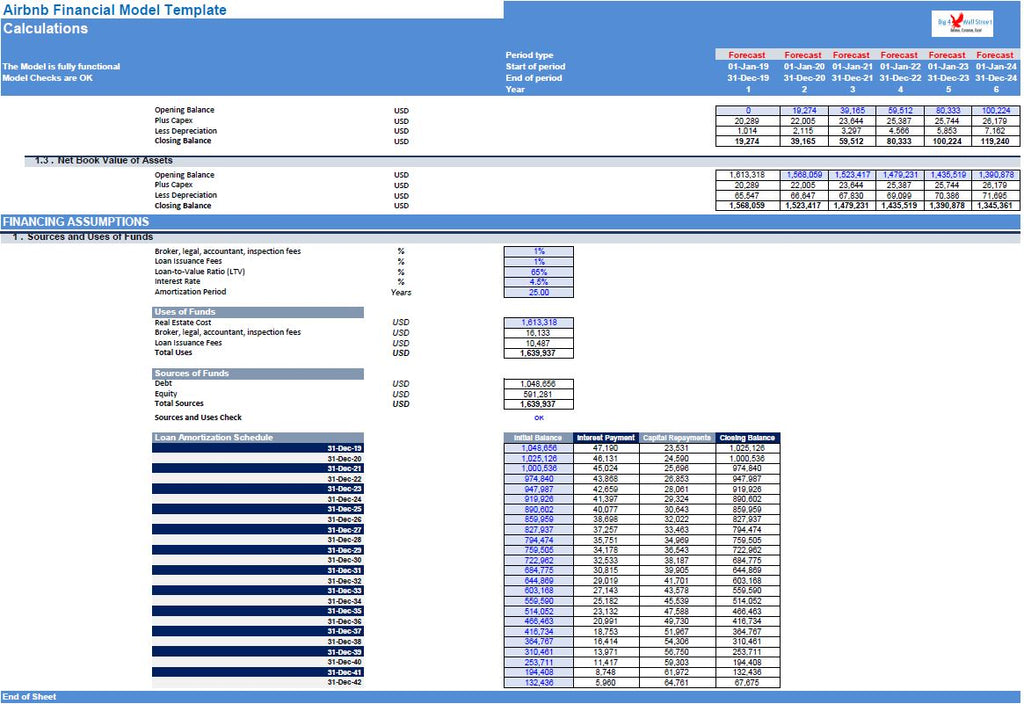
Calculations: this were all calculations are performed. Revenues, Expenses, Taxes are calculated as well as Net Book Value of Assets and Capex and financing calculations like loan amortization and source and uses of funds.
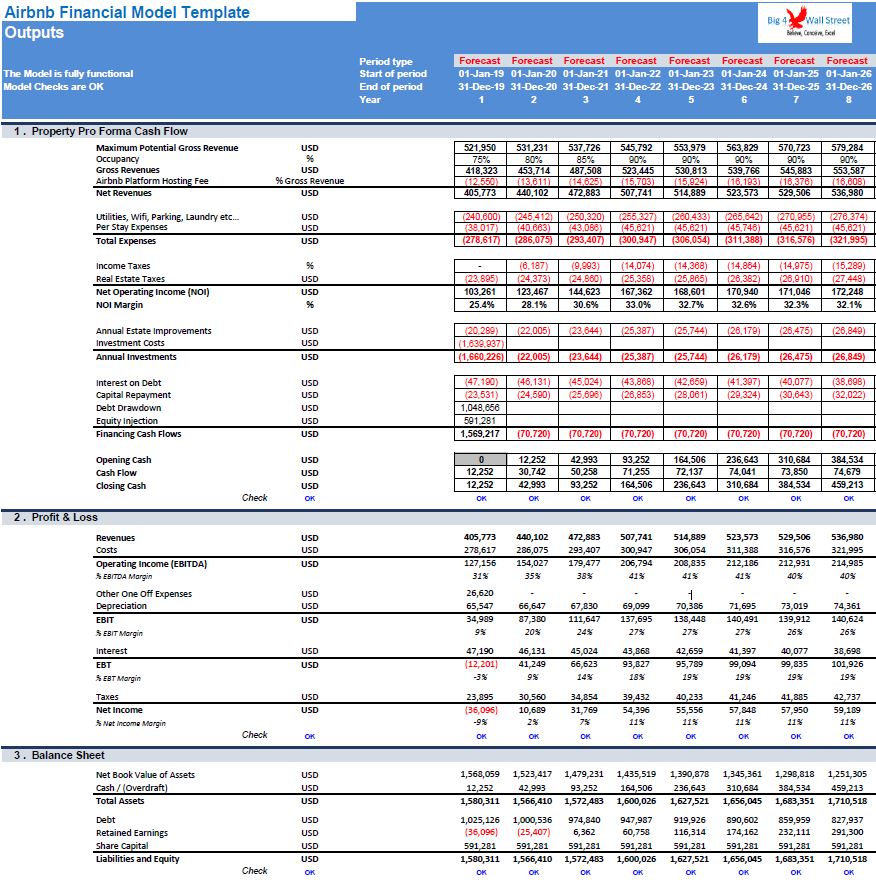
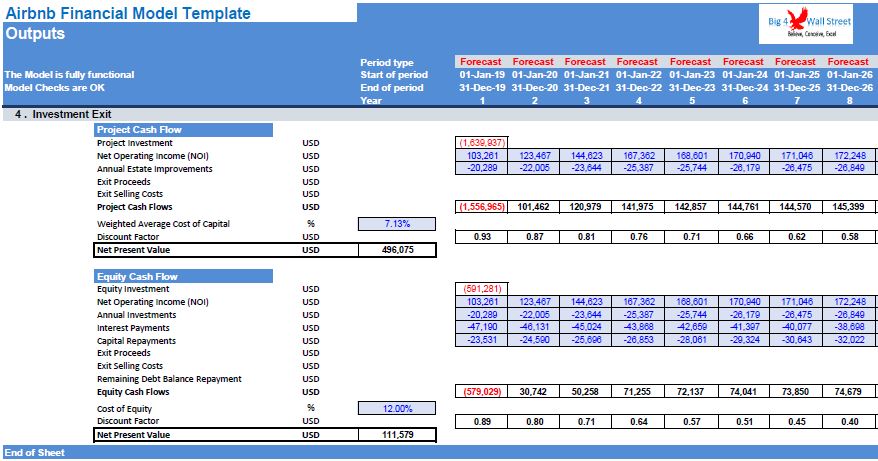
In the Outputs tab: everything is aggregated here into the relevant statements: profit and loss, balance sheet and cash flow. Additionally we present the cash flows on a project as well as on an equity basis to arrive at the net present value.
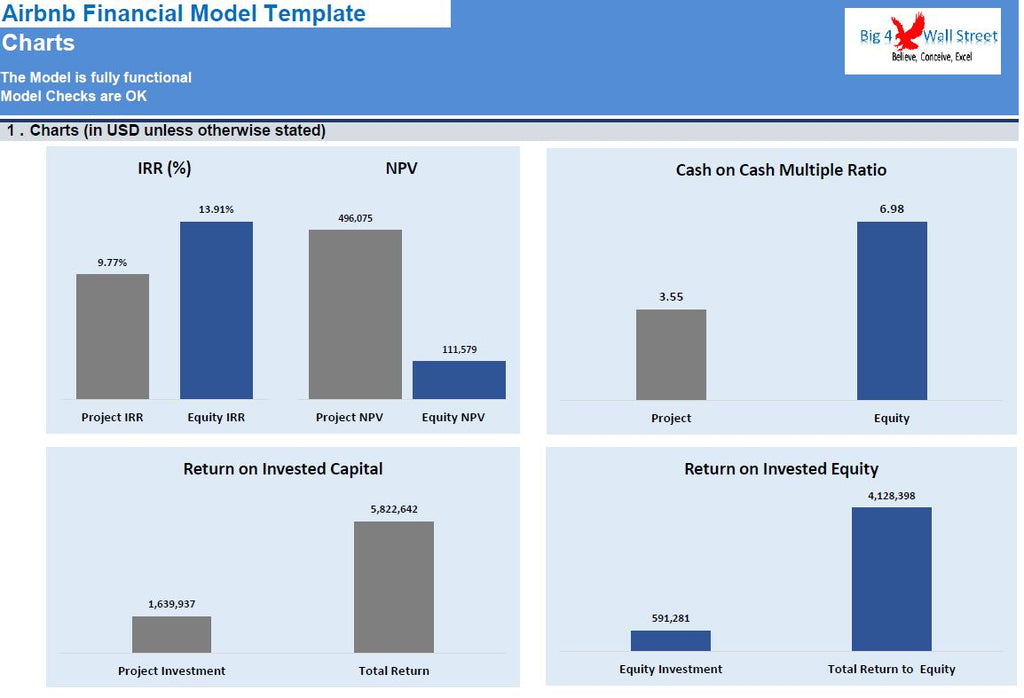
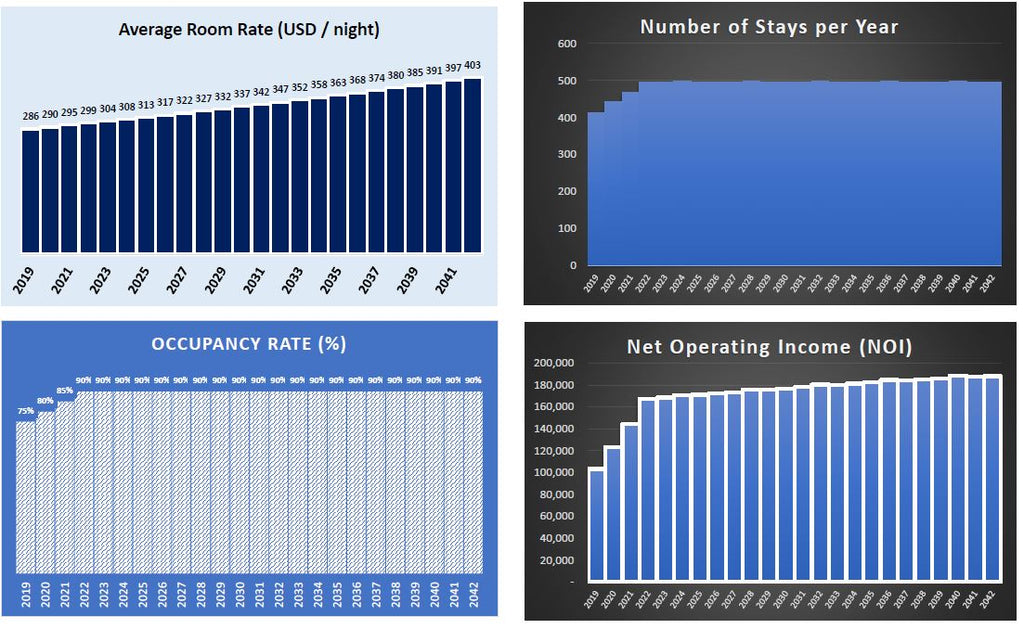
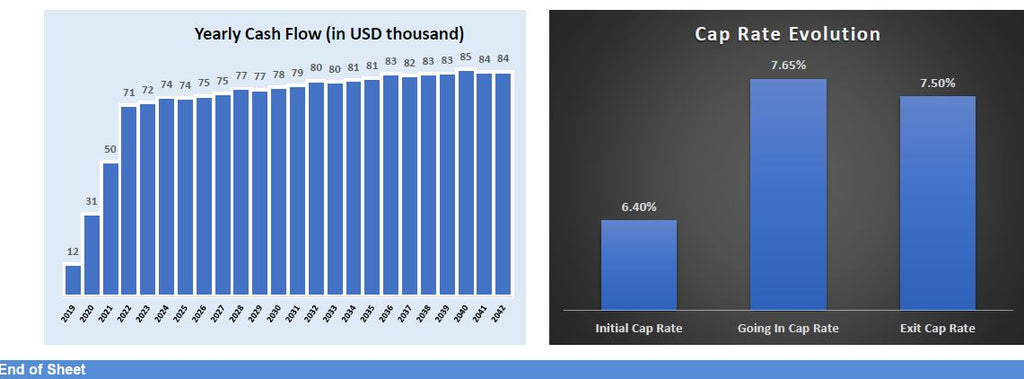
In the charts tab: Various graphs present the various KPIs such as Internal Rate of Return, Net Present Value, Cash on Cash Multiple, Return on Investment, Average room rate, number of stays per year, occupancy rate, net operating income, yearly cash flow and cap rate evolution.
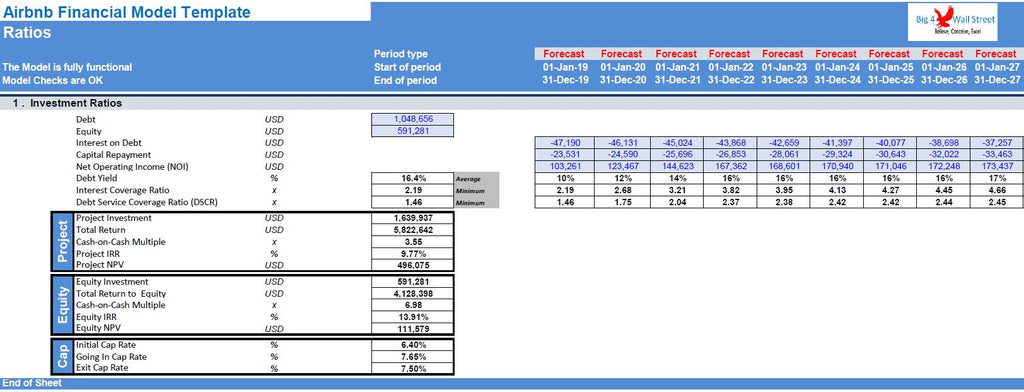
Moving to the Ratio tab, a series of investment metrics are presented (Net Present Value, Internal Rate of Return, Cash on Cash multiple). Additionally the Debt Service Coverage Ratio, Interest Coverage Ratio and Debt Yield are presented.
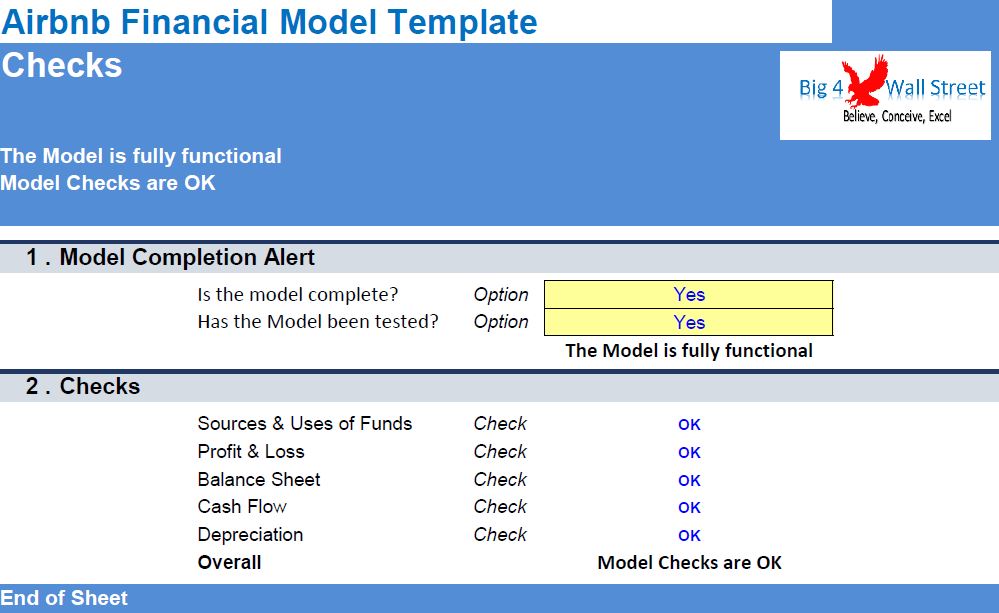
Checks: A dedicated worksheet that makes sure that everything is working as it should!