
Monte Carlo Simulation in Excel
The model presents an example of a Monte Carlo Simulation using excel to estimate the Net Present Value of an investment.
Monte Carlo simulation is commonly used to evaluate the risk and uncertainty that would affect the outcome of different decision options. It also allows to incorporate the total effects of uncertainty in variables like sales volume, prices and costs, interest and exchange rates, as well as the effect of distinct risk events.
Monte Carlo methods in finance are often used to evaluate investments in projects at a business unit or corporate level, or to evaluate financial derivatives. They can be used to model project schedules, where simulations aggregate estimates for worst-case, best-case, and most likely duration for each task to determine outcomes for the overall project.
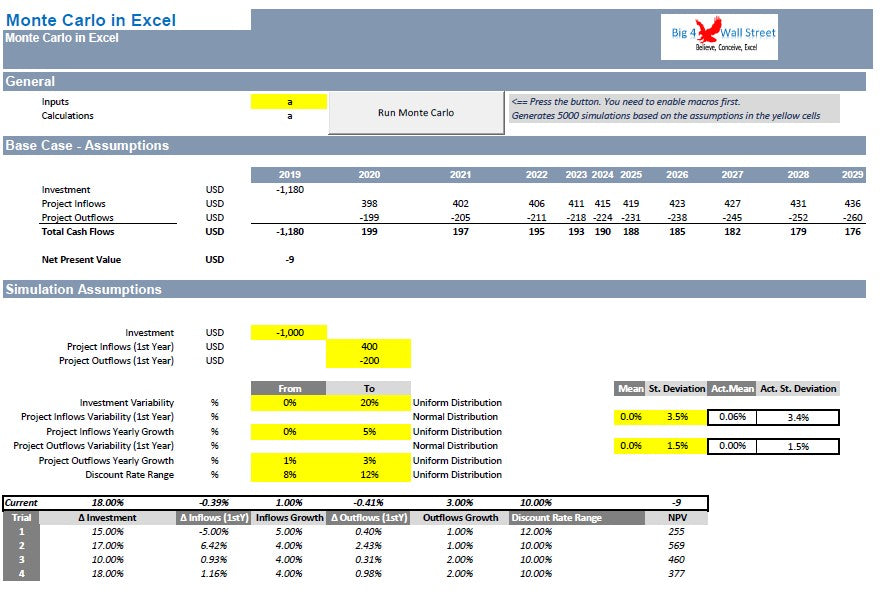
In this excel model, we will use the Monte Carlo simulation to evaluate a simple investment project. In our case we have three base case assumptions. These are: the investment, the cash inflows for the first year, and the cash outflows for the first year. We modify these three assumptions accordingly.
The investment and the cash outflow should be entered as negative numbers, while the cash inflow as a positive number. In lines 28 to 33, we have the monte carlo simulation parameters. More precisely, these are: The investment variability: the user needs to set the upper and lower values of the uniform distribution which will be a random number within this range and will increase the investment by a random number in this range.
For the Project Inflows and Outflows Variability in the first year as well as the discount rate, the user sets the mean and the standard deviation of the normal distribution, which will be used to increase or decrease the first year Inflows or Outflows. Finally for the Project Inflows and Outflows Yearly Growths, as well as for the discount rate, we have to input the upper and lower percentages of the uniform distribution. A random number is selected within this range.
By combining all the above assumptions for the investment, the cash inflows, cash outflows, and the discount rate, we are able to calculate the Net Present Value of the investment.
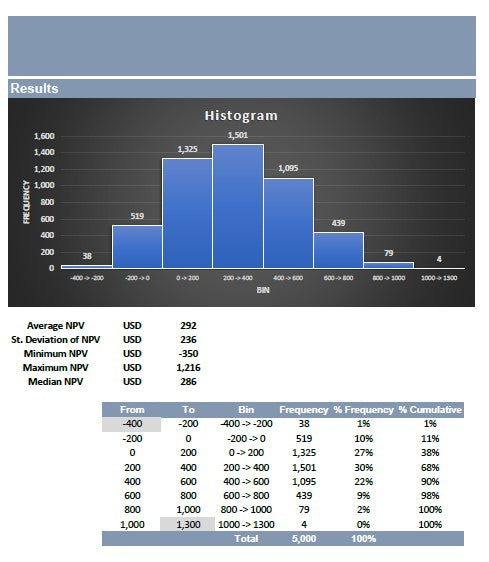
Afterwards, press the command button "Run Monte Carlo", this will produce 5 thousand simulation based on the parameters set. Once the simulation is over, go to the charts on the right where you can see the results. An histogram is produced which presents for each bin of Net Present Values, the occurrences in this range (otherwise known as frequencies).
The user can also see the relevant table used to produce the histogram chart, as well as various metrics such as: average Net Present Value, Standard Deviation, Minimum, Maximum, and Median.