


12 Questions 3-Way Model
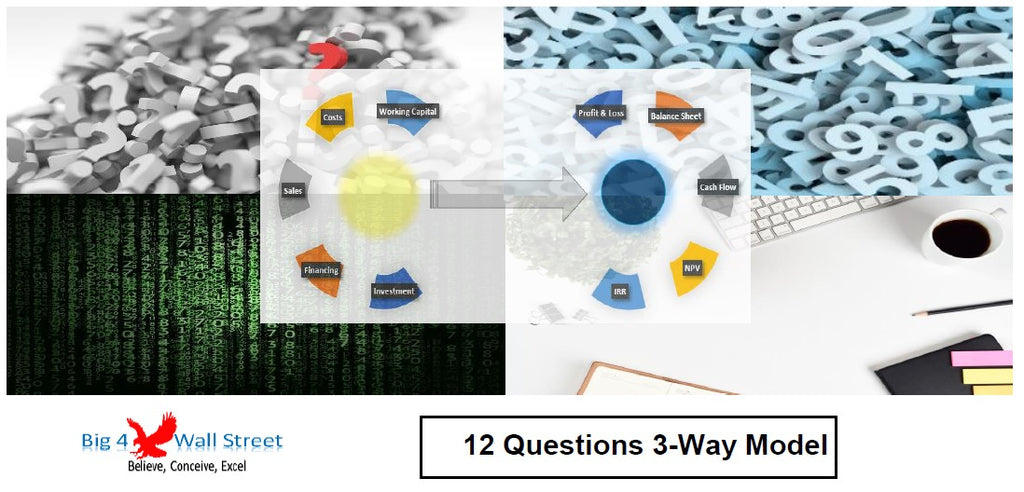
The 12 Questions Model based on only 12 simple questions generates the three financial statements (Profit & Loss, Balance Sheet and Cash Flow), investment metrics, a series of graphs, as well as a summary page with the key figures.
So, a quick overview of the model, in the contents tab you can see the structure of the model and by clicking on any of the headlines to be redirected to the relevant worksheet.
On the manual tab you can feed the general information for the model such as: model name, responsible, timeline of the model and date and currency conventions.
Additionally there is a description of the color coding of the model in the same tab. Inputs are always depicted with a yellow fill and blue letters, call up (that is direct links from other cells) are filled in light blue with blue letters while calculations are depicted with white fill and black characters.
There is also a color coding for the various tabs of the model. Yellow tabs are mostly assumptions tabs, grey tabs are calculations tabs, blue tabs are outputs tabs (that is effectively results or graphs) and finally light blue tabs are admin tabs (for example: the cover page, contents and checks).
Moving on to the inputs tab (in yellow whatever can be amended as an assumption): the user needs to answer 12 questions which are grouped into 5 main sections:
- Investment: how much money are you going to invest? and in how many years are you going to depreciate the assets purchased.
- Financing: how much debt are you going to use to finance your investment, and at what interest rate? what is your desired return on your investment (cost of equity)?
- Sales: what are your forecasted sales for the next 5 years?
- Costs: what are your forecasted cost margins, as well as your other operating costs for the next 5 years? What is your corporate income tax rate?
- Working Capital: in how many days are you going to collect sales, pay your direct costs, and for how many days are going to keep inventory.
Everything is calculated in the Calcs tab based on the assumptions you have set previously.
From the calcs the three financial statements are generated in the Outputs tab, the profit and loss, balance sheet and cash flow. In the Metrics tab a series of investment metrics are calculated such as Enterprise Value, Shareholder Value, Internal Rate of Return, Cash on Cash Multiple, Payback Period, Debt Service Coverage Ratio, and Loan Life Coverage Ratio.
Additionally on the graphs tab, a series of charts are presented: revenues, costs, margins, profitability, coverage ratios, cash, debt, working capital, cash flows, valuation, payback, and returns and discount rates.
A summary tab aggregates the main figures and KPIs from the entire model in a page that can be readily printed for your convenience.
Finally the checks tab where the most critical checks are aggregated. Whenever you see an error message in any page, you should consult this page to see where the error is coming from.